Live Visualizations
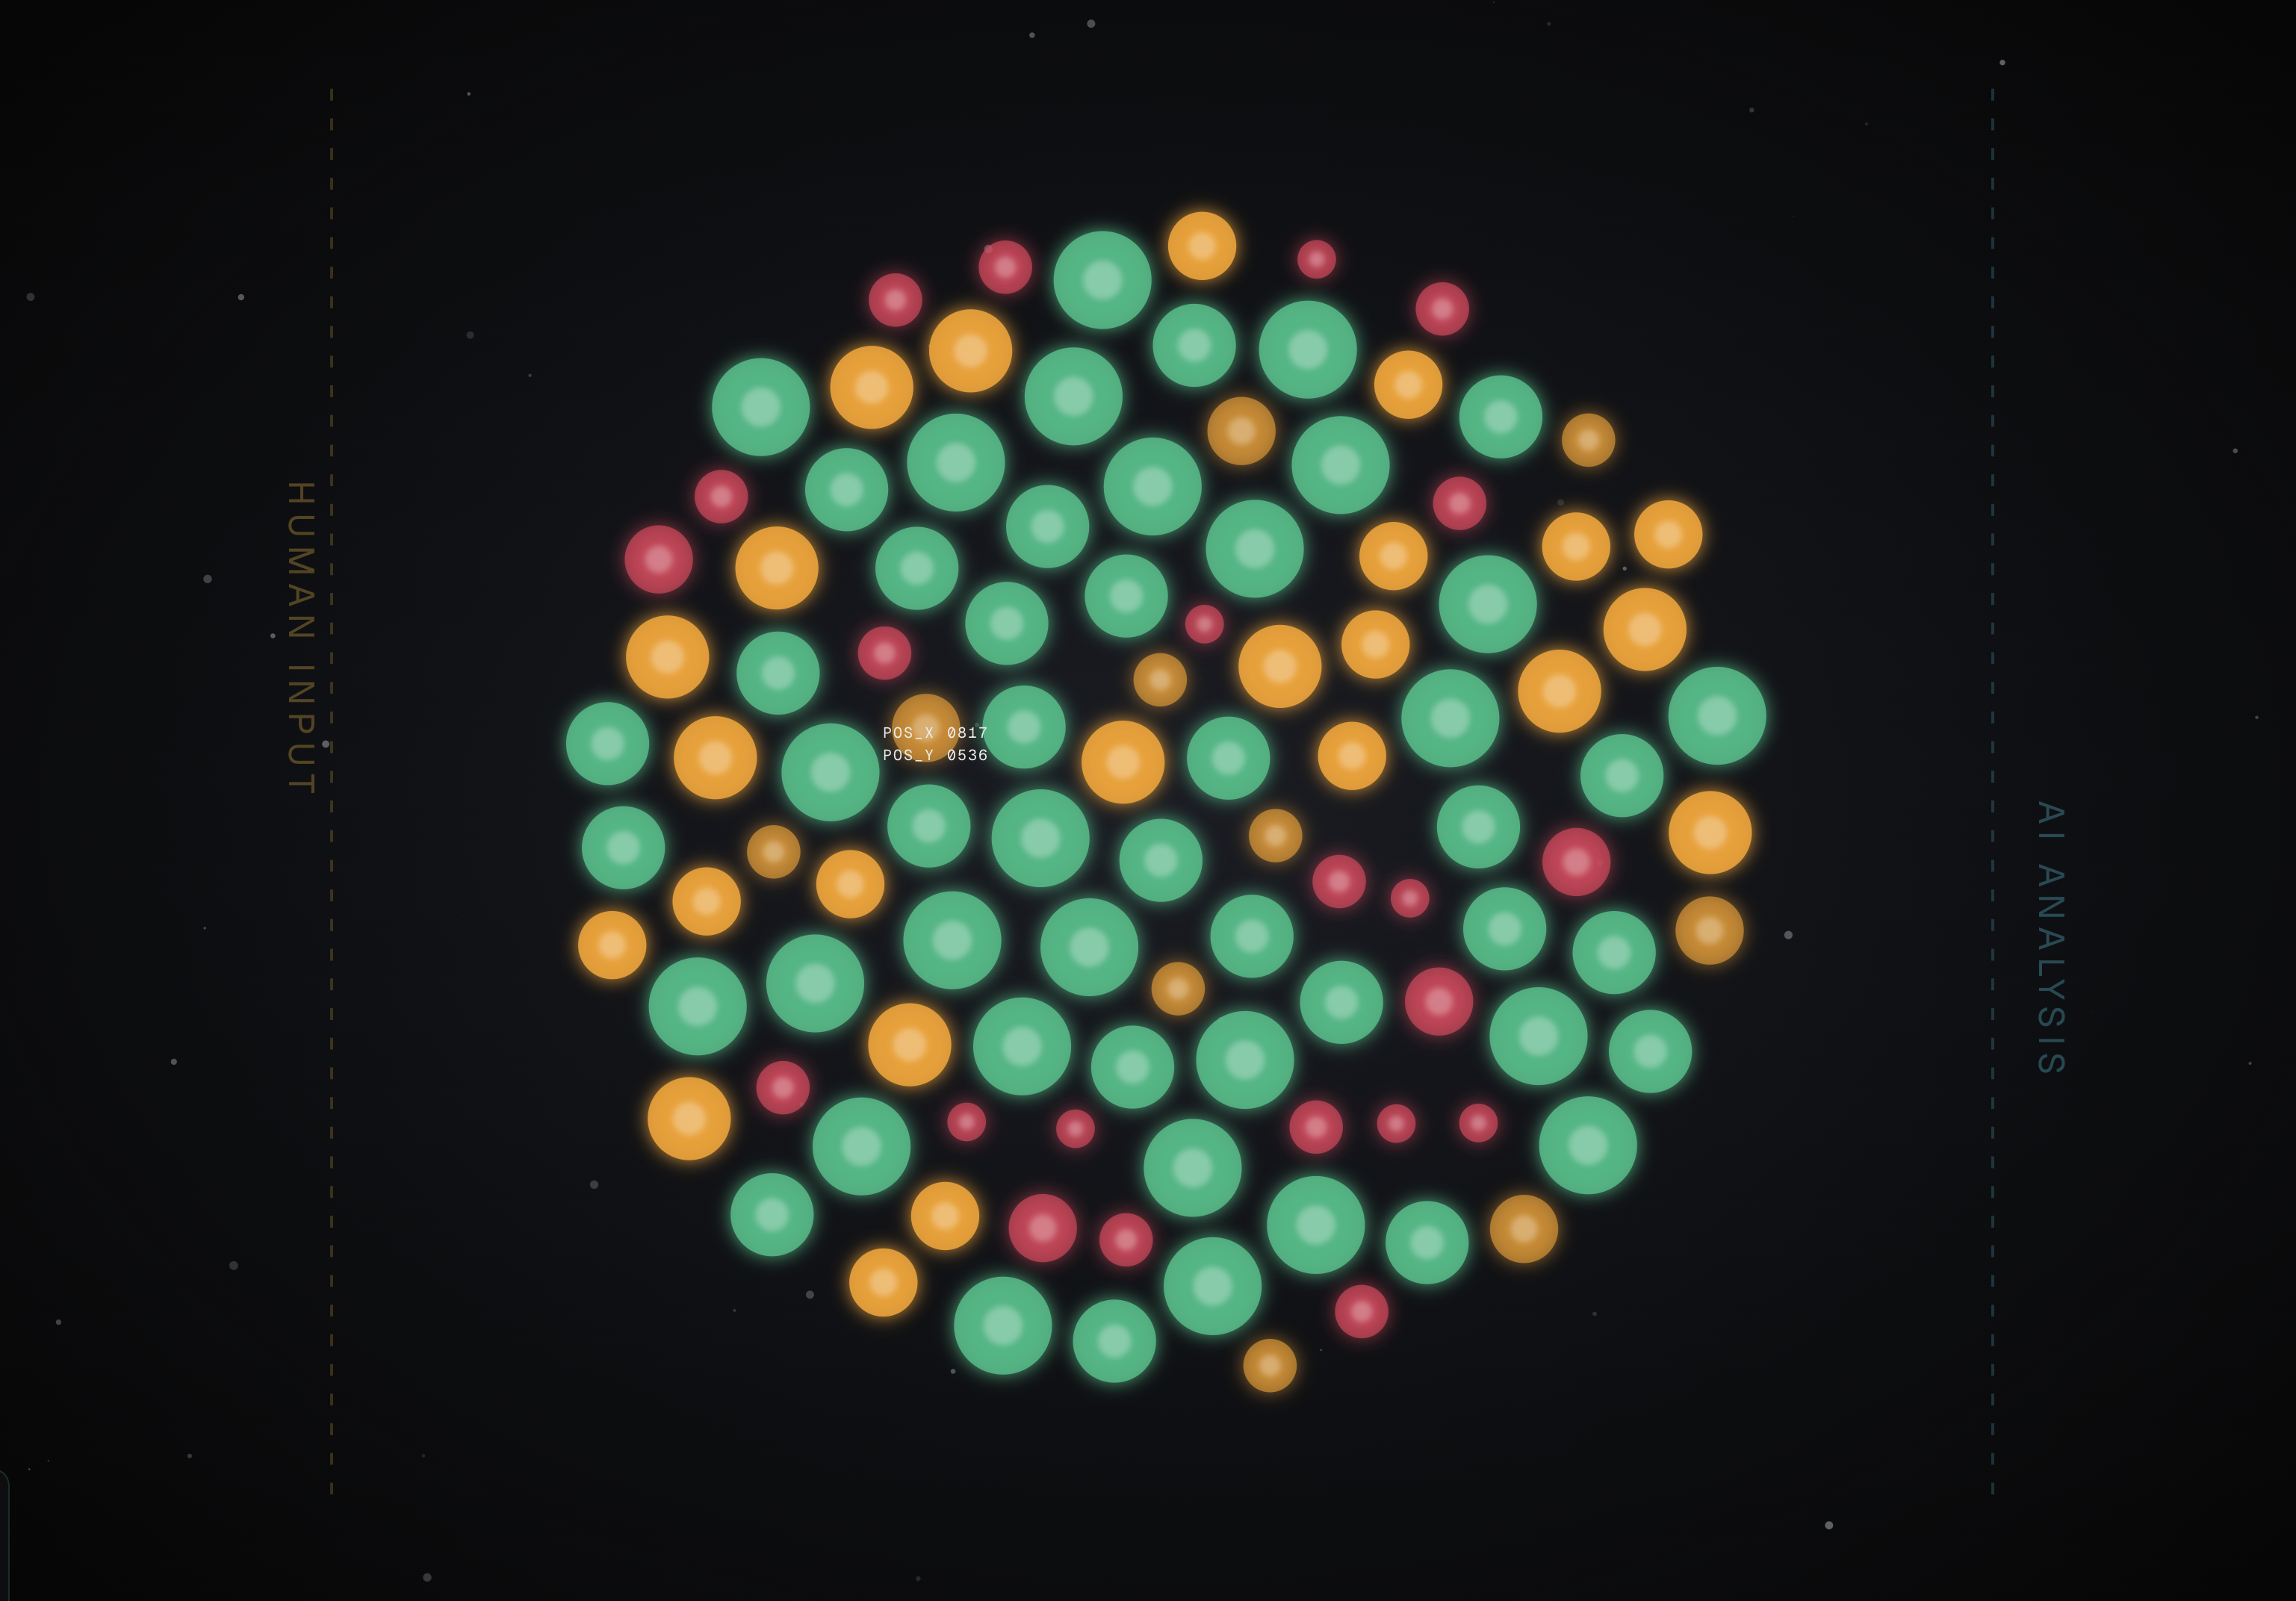
Human-AI Collaboration
Explore trust and reliability in human-AI collaboration through an interactive digital garden.

NYC OpenData — Corporate KYC Matrix
A cyberpunk visualization of corporate networks, revenue flows, and high-risk entity detection.
ARC Data Tool - Data Availability
An interactive D3.js visualization showing data availability coverage across case pipeline stages over time.
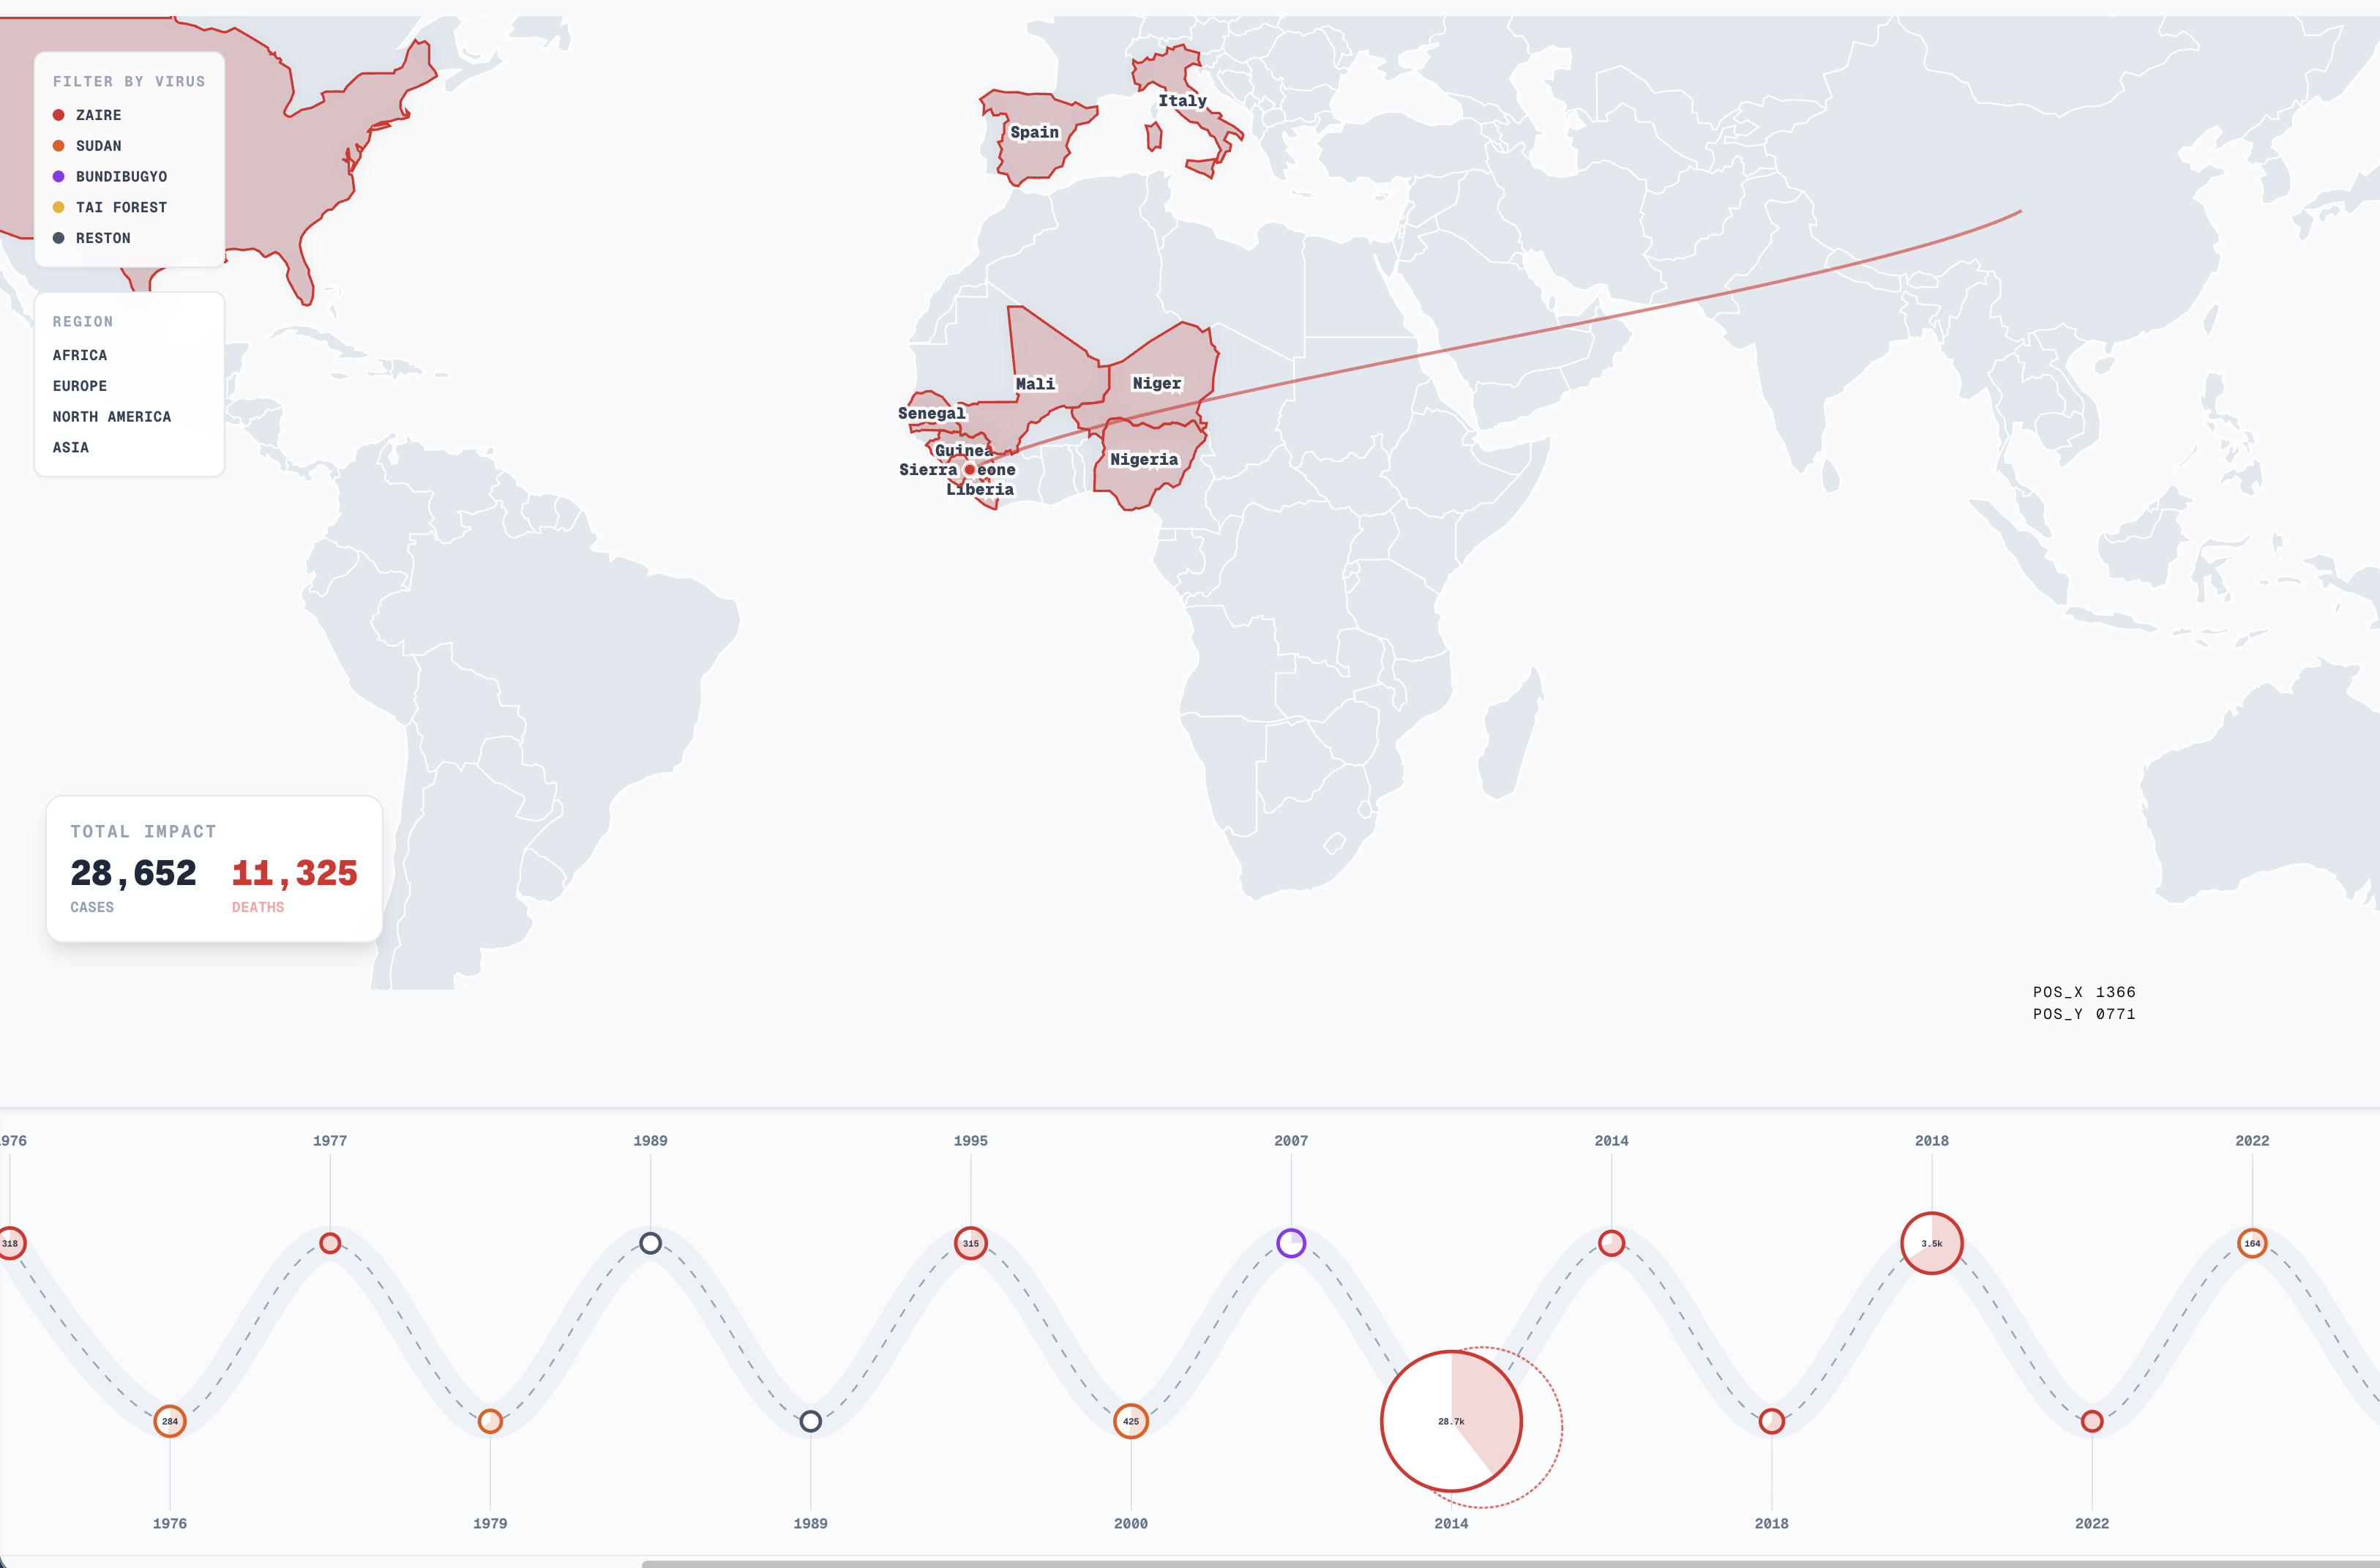
CDC — Ebola Outbreak Cartography
A visual exploration of the 2014 Ebola outbreak.
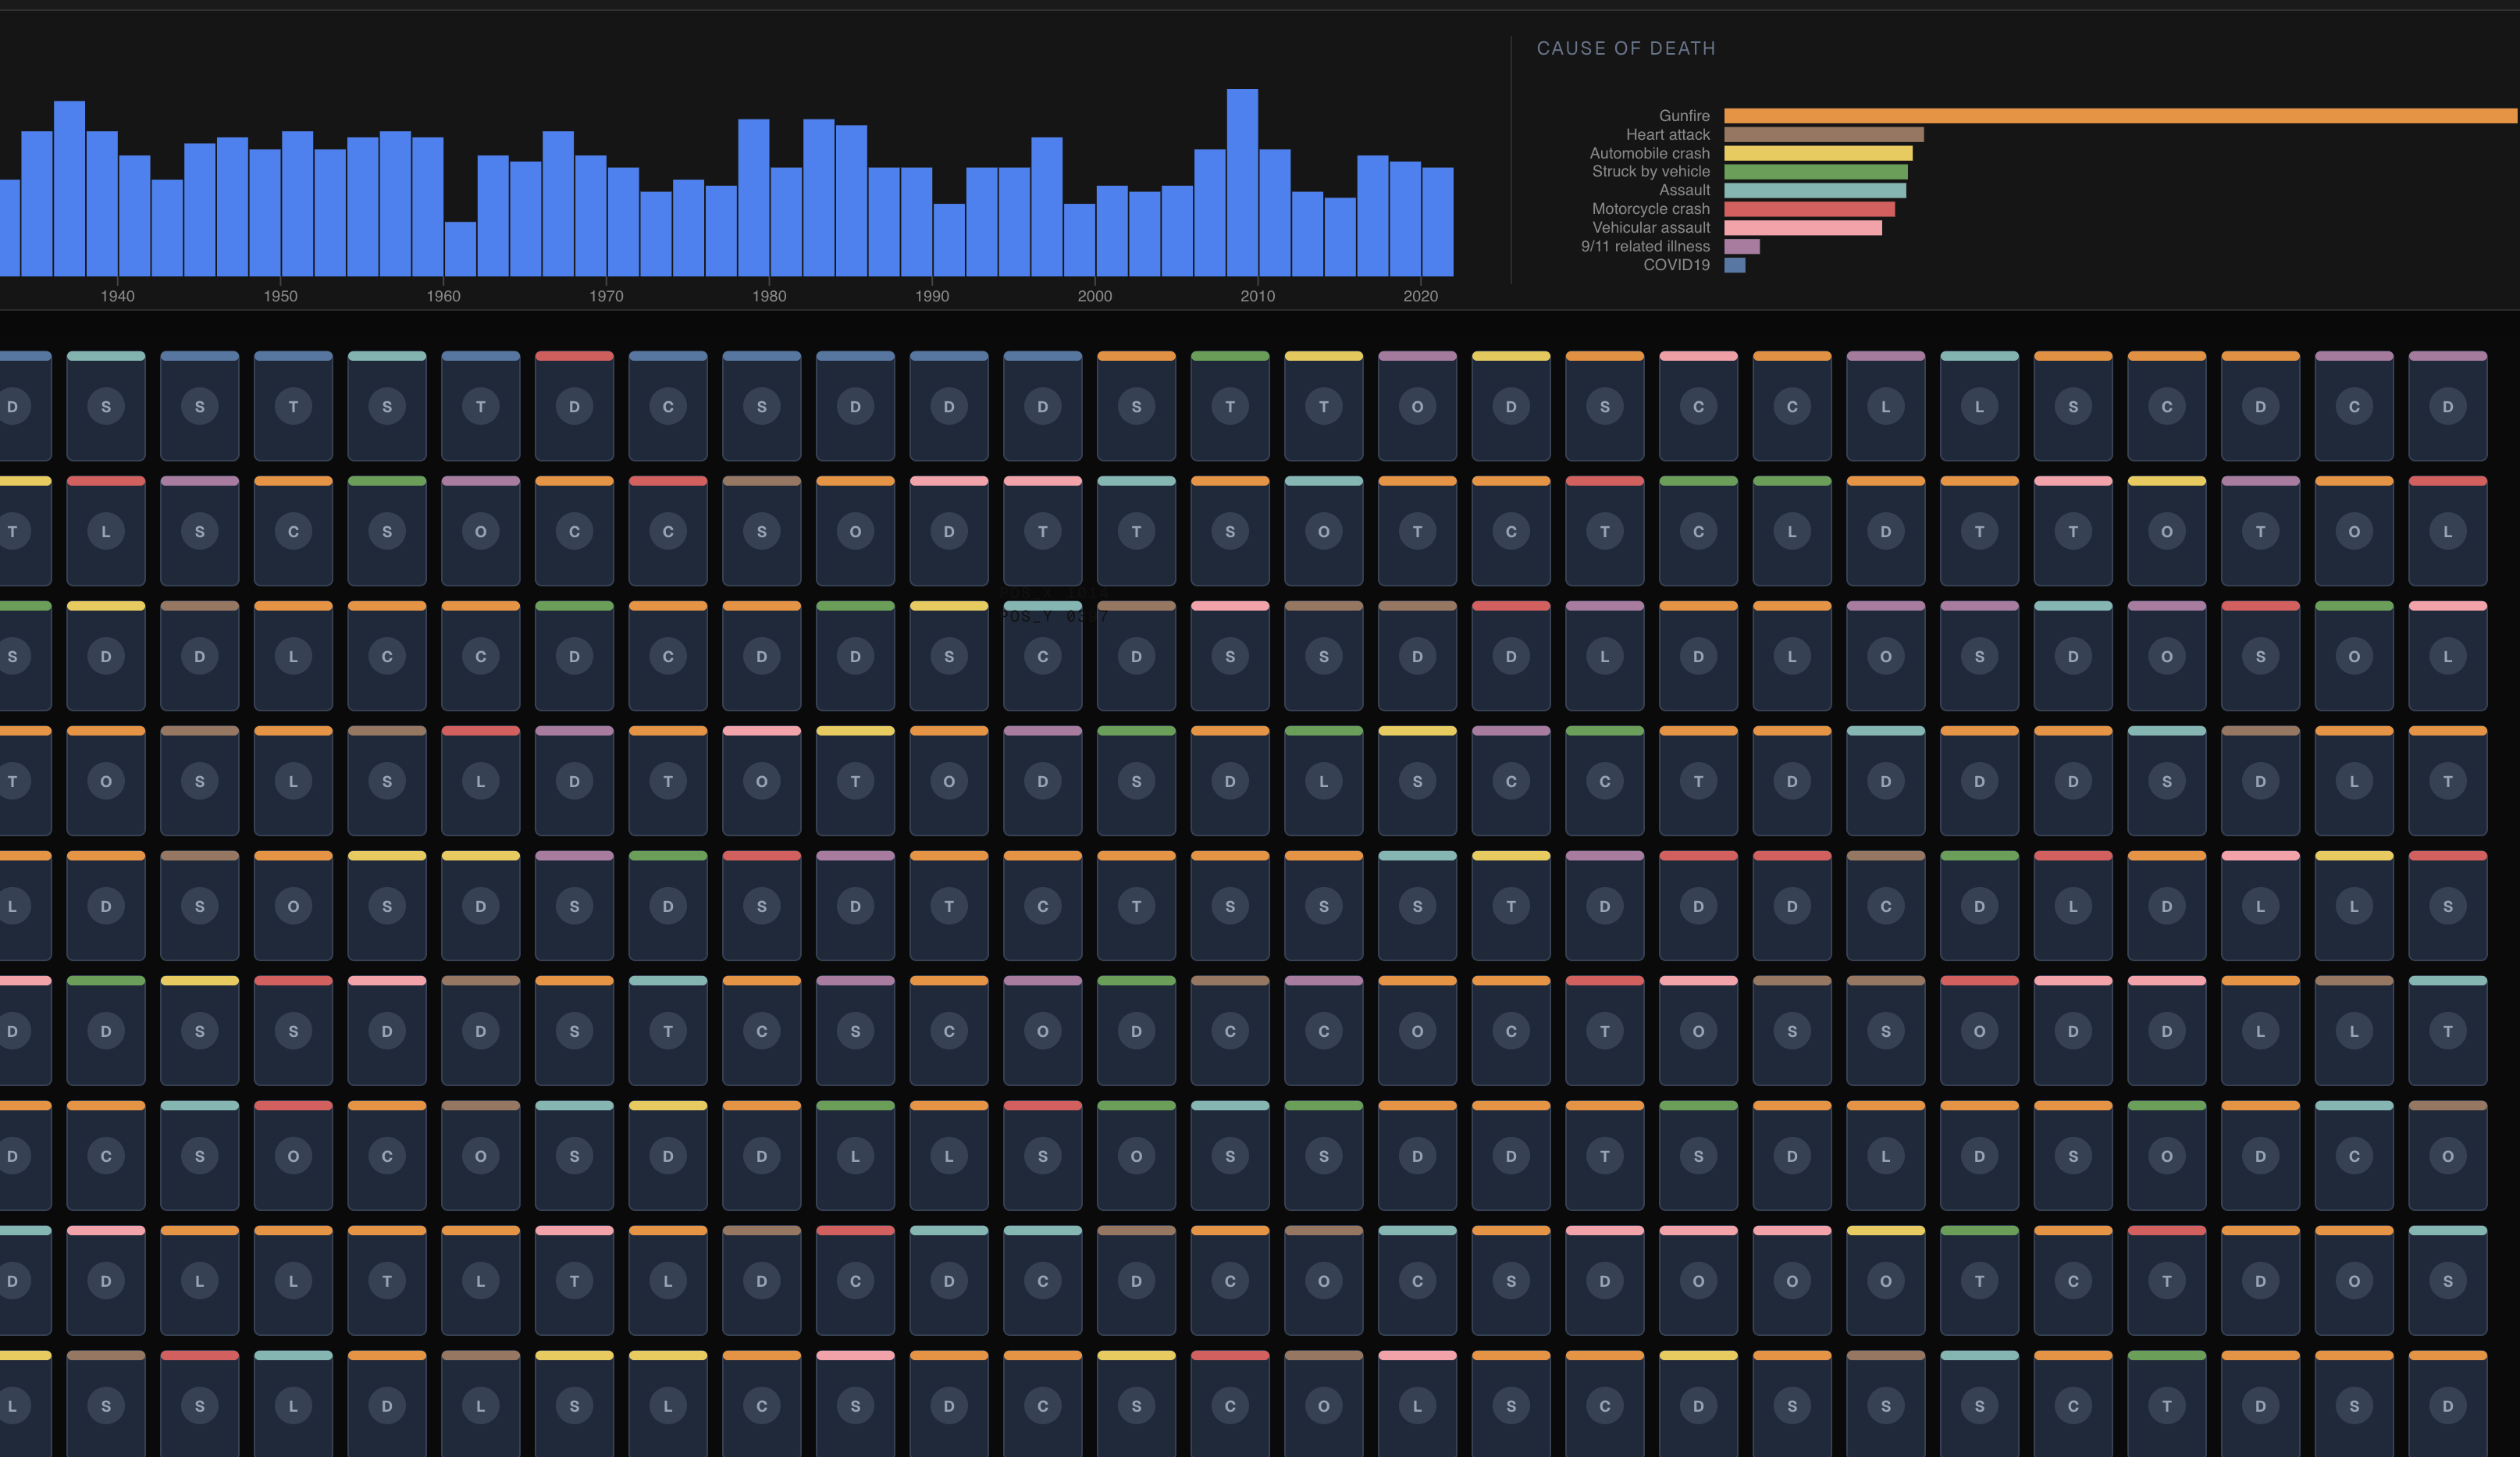
ODMP — End of Watch Archive
A visual archive of police line-of-duty deaths (1791-2022).
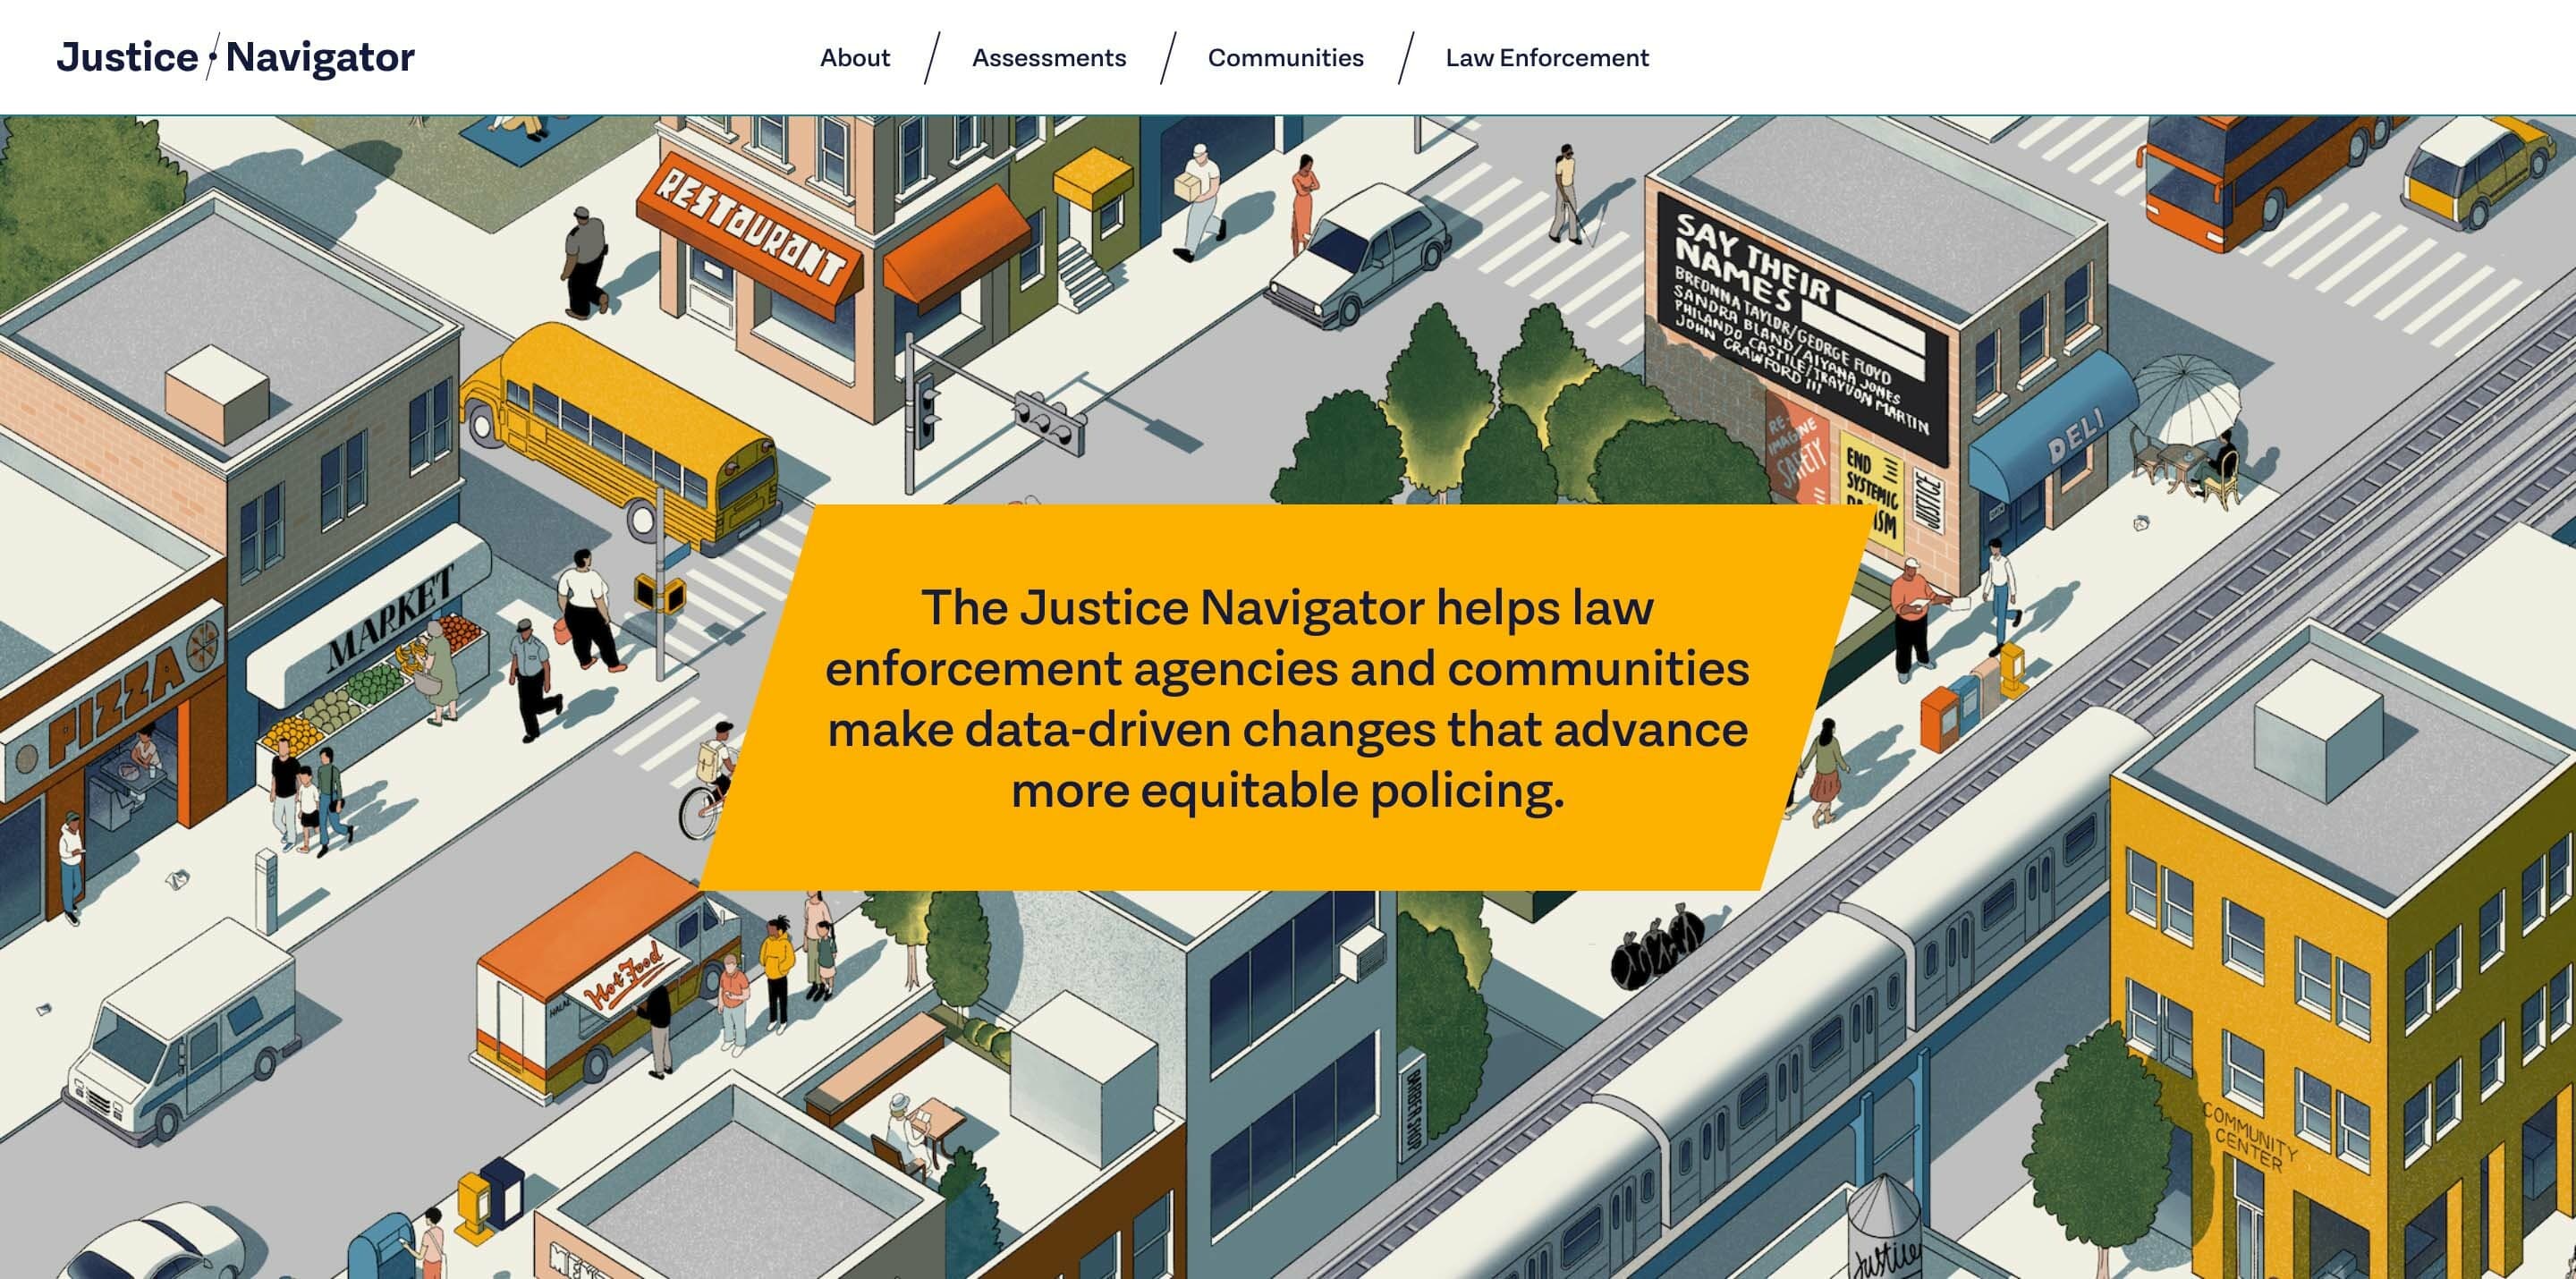
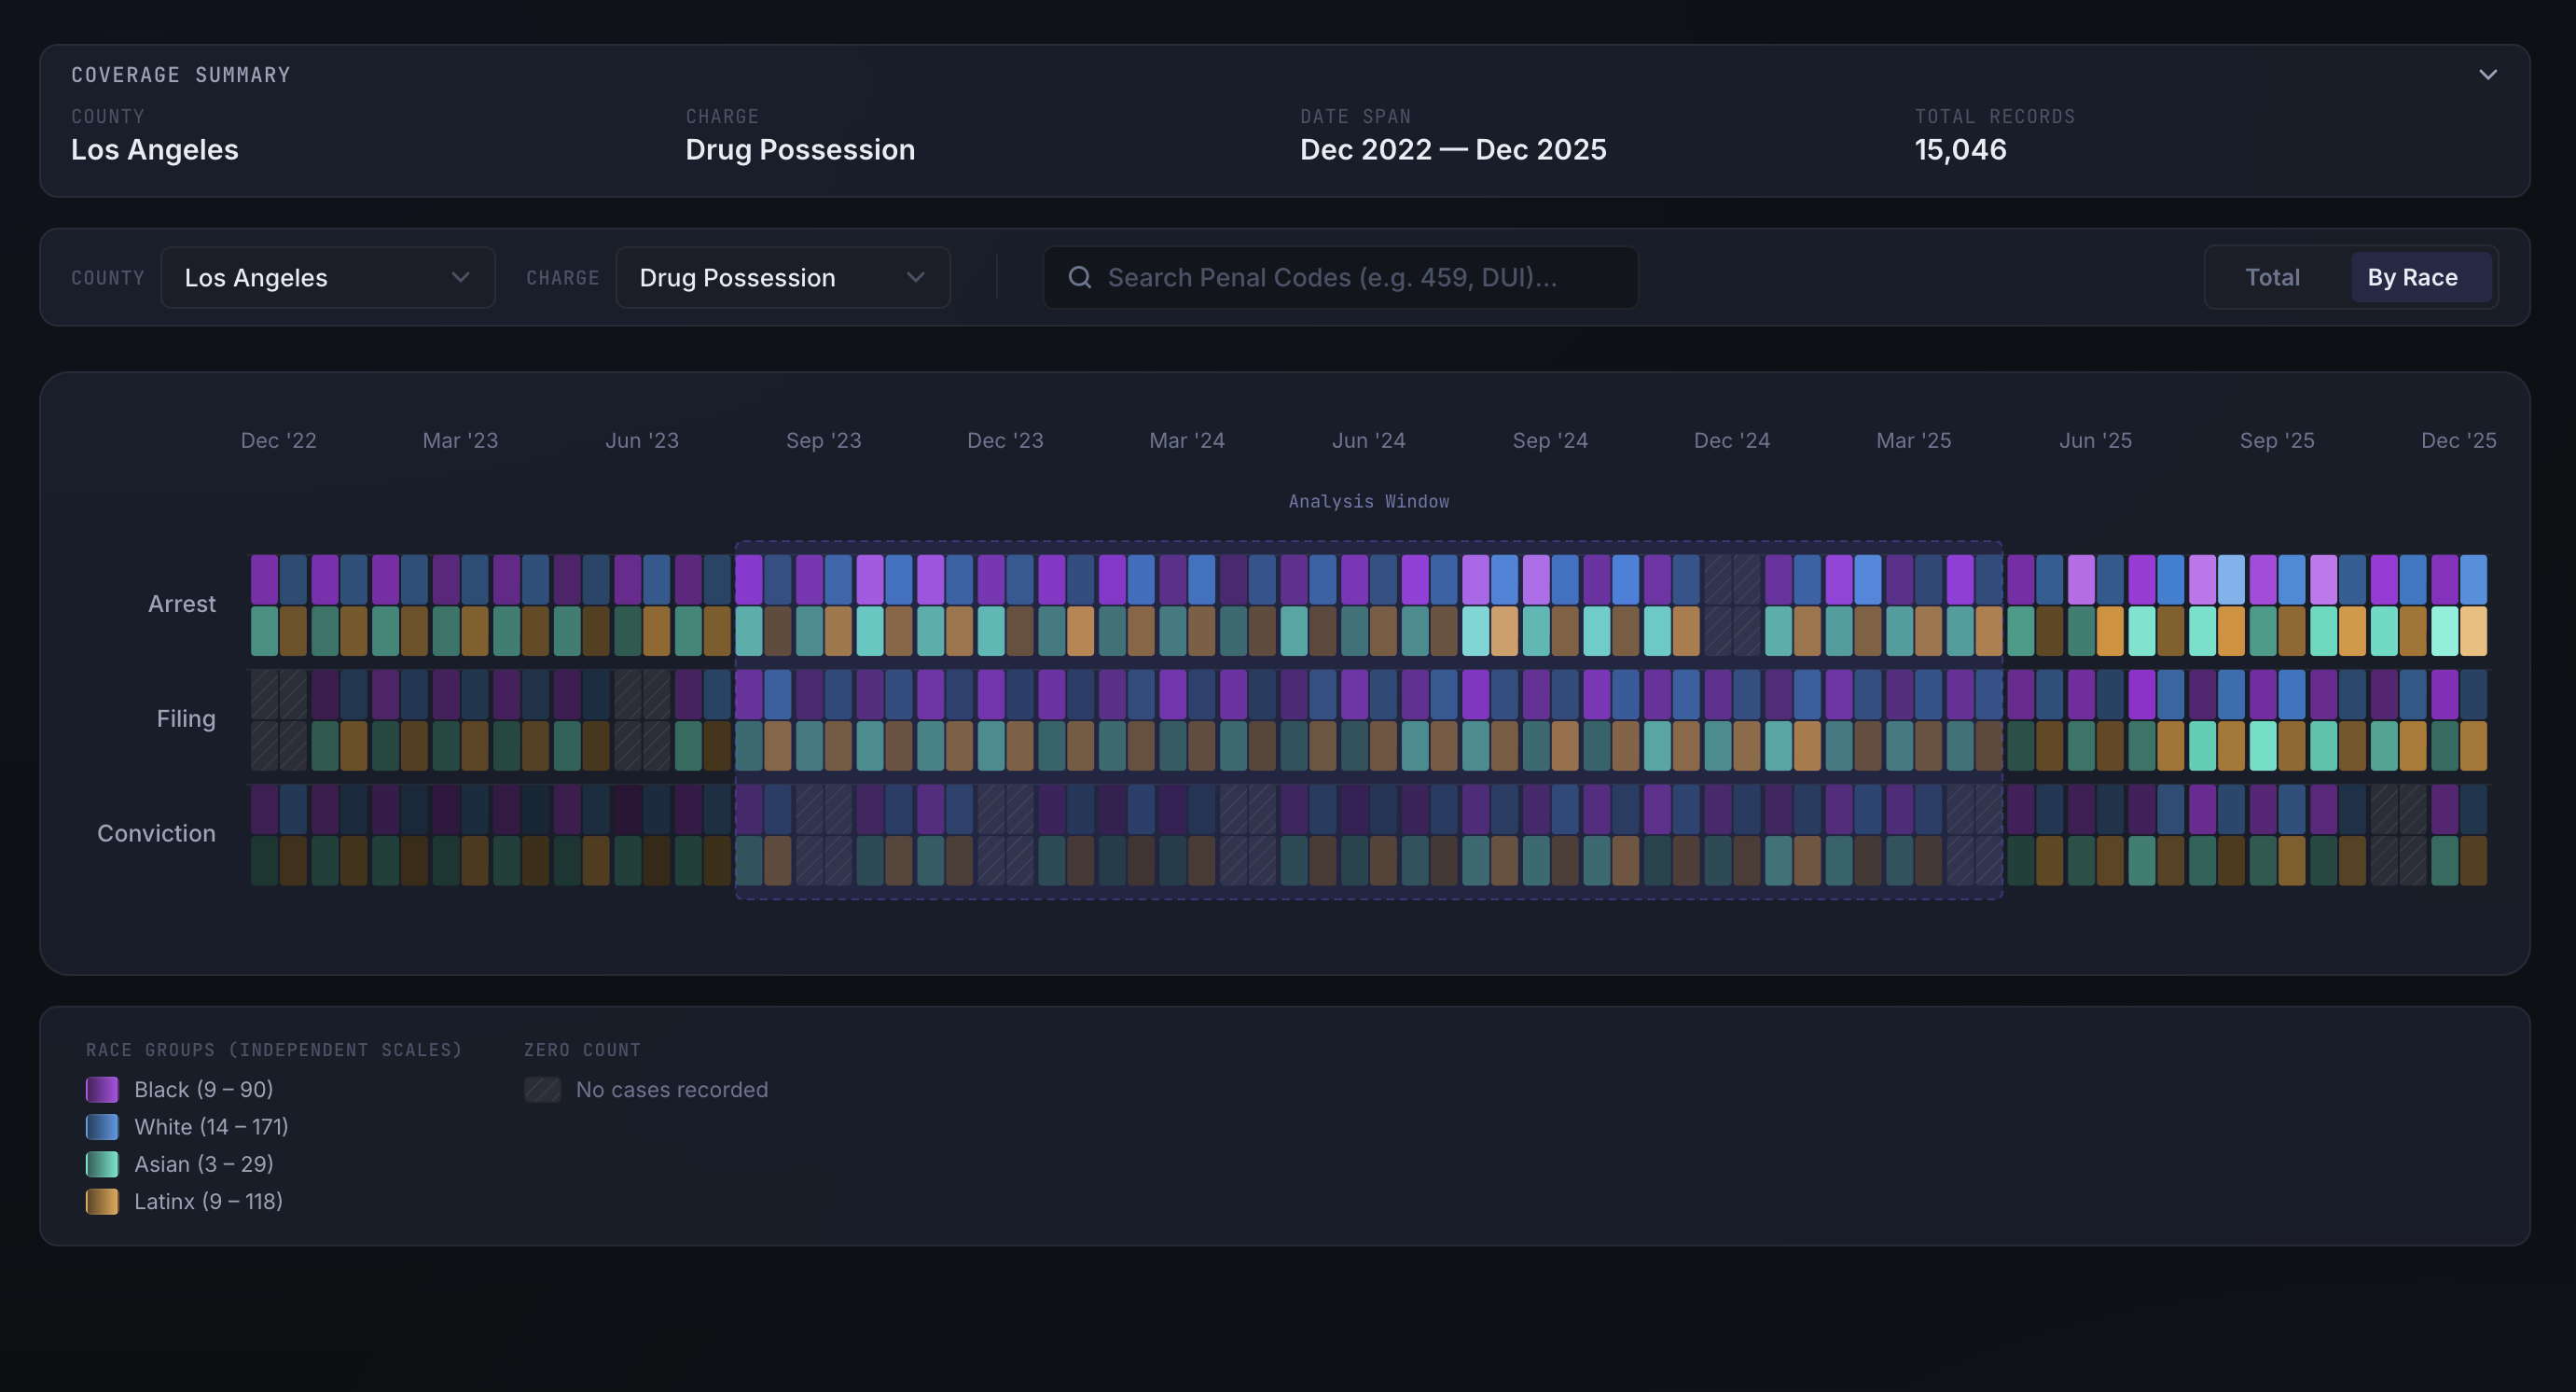
Google-CPE Justice Navigator
A transparency tool for policing data developed with Google.org, helping identify and reduce racial disparities through data-driven insights.
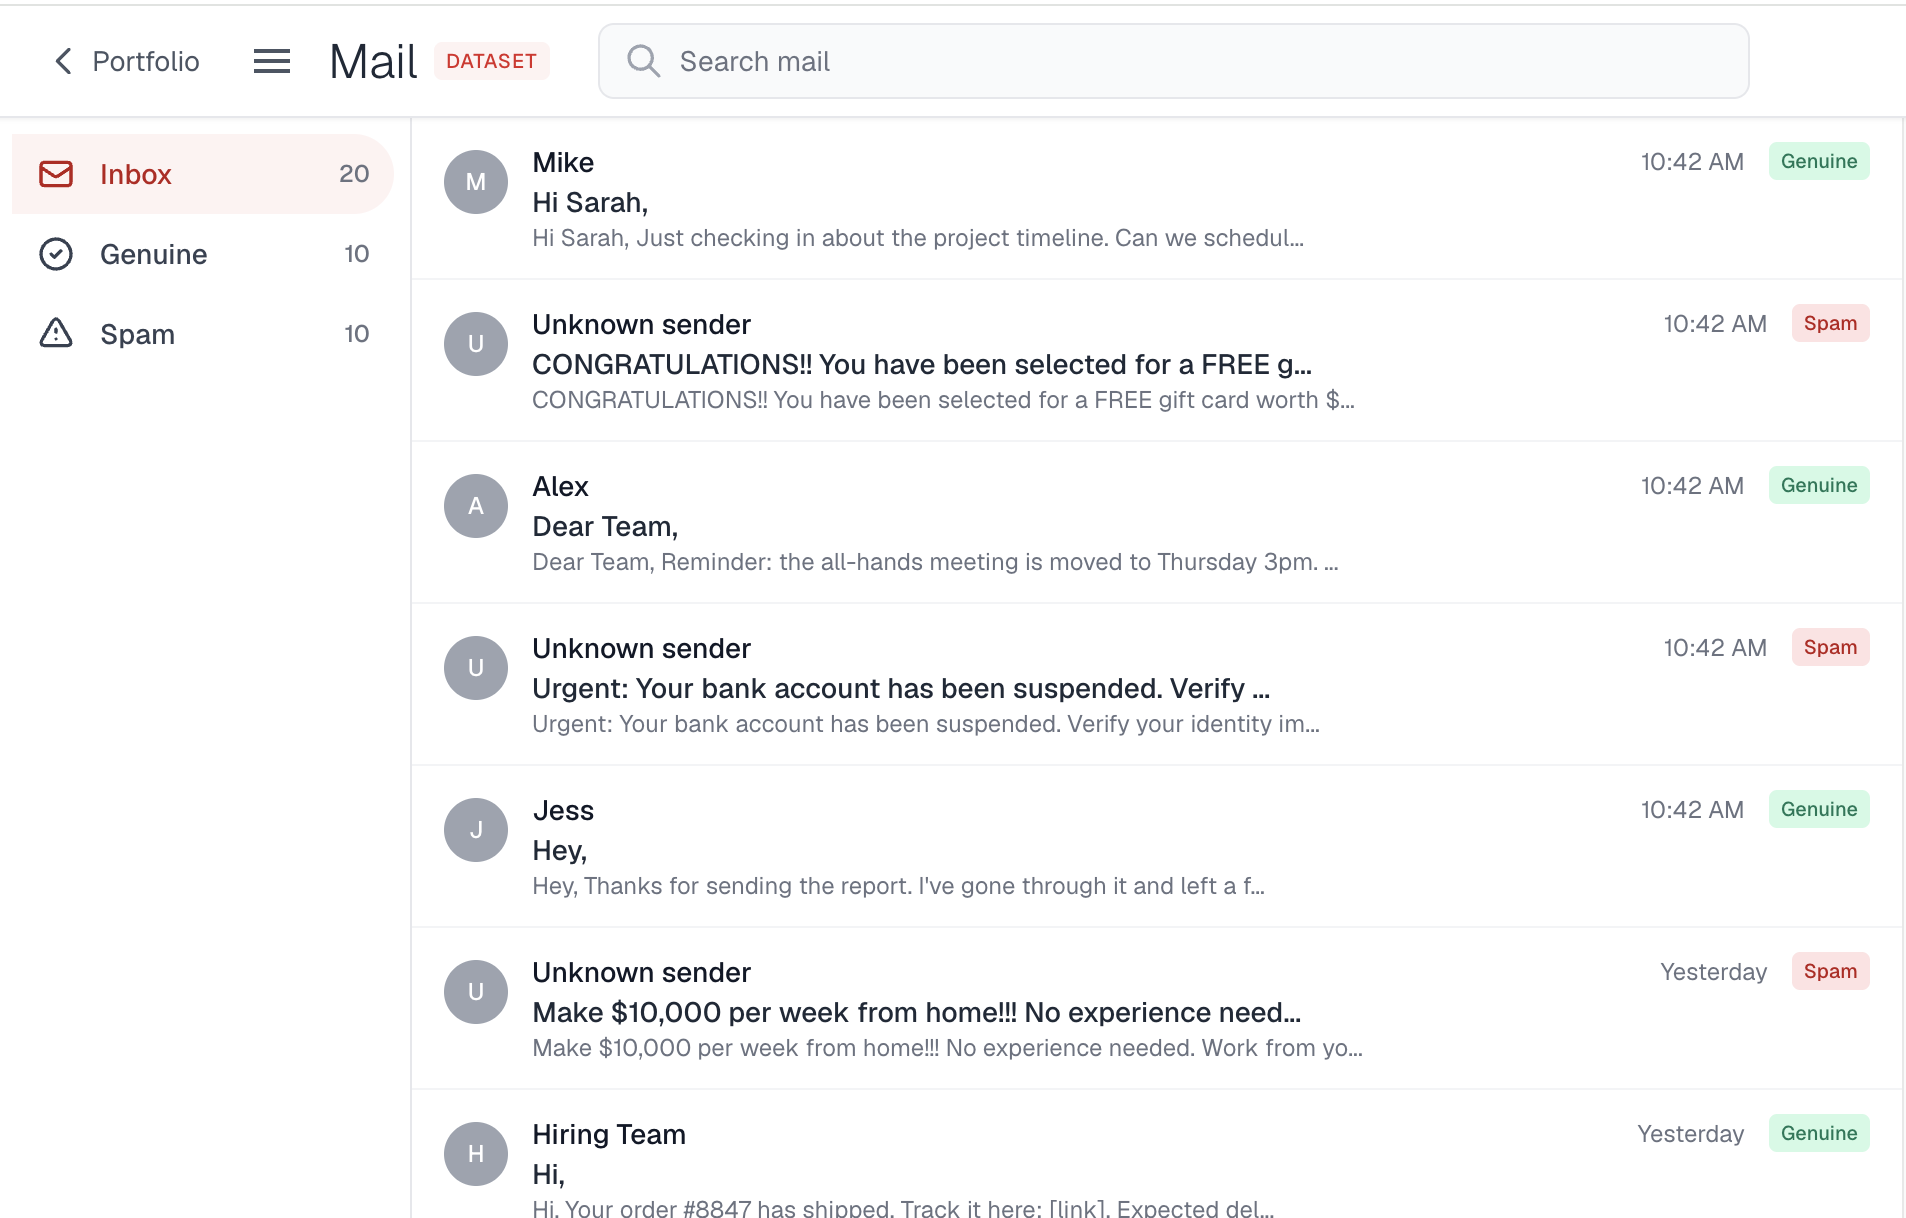
Spam Classification Inbox
An artistic D3.js visualization: interact with envelopes in a digital void.
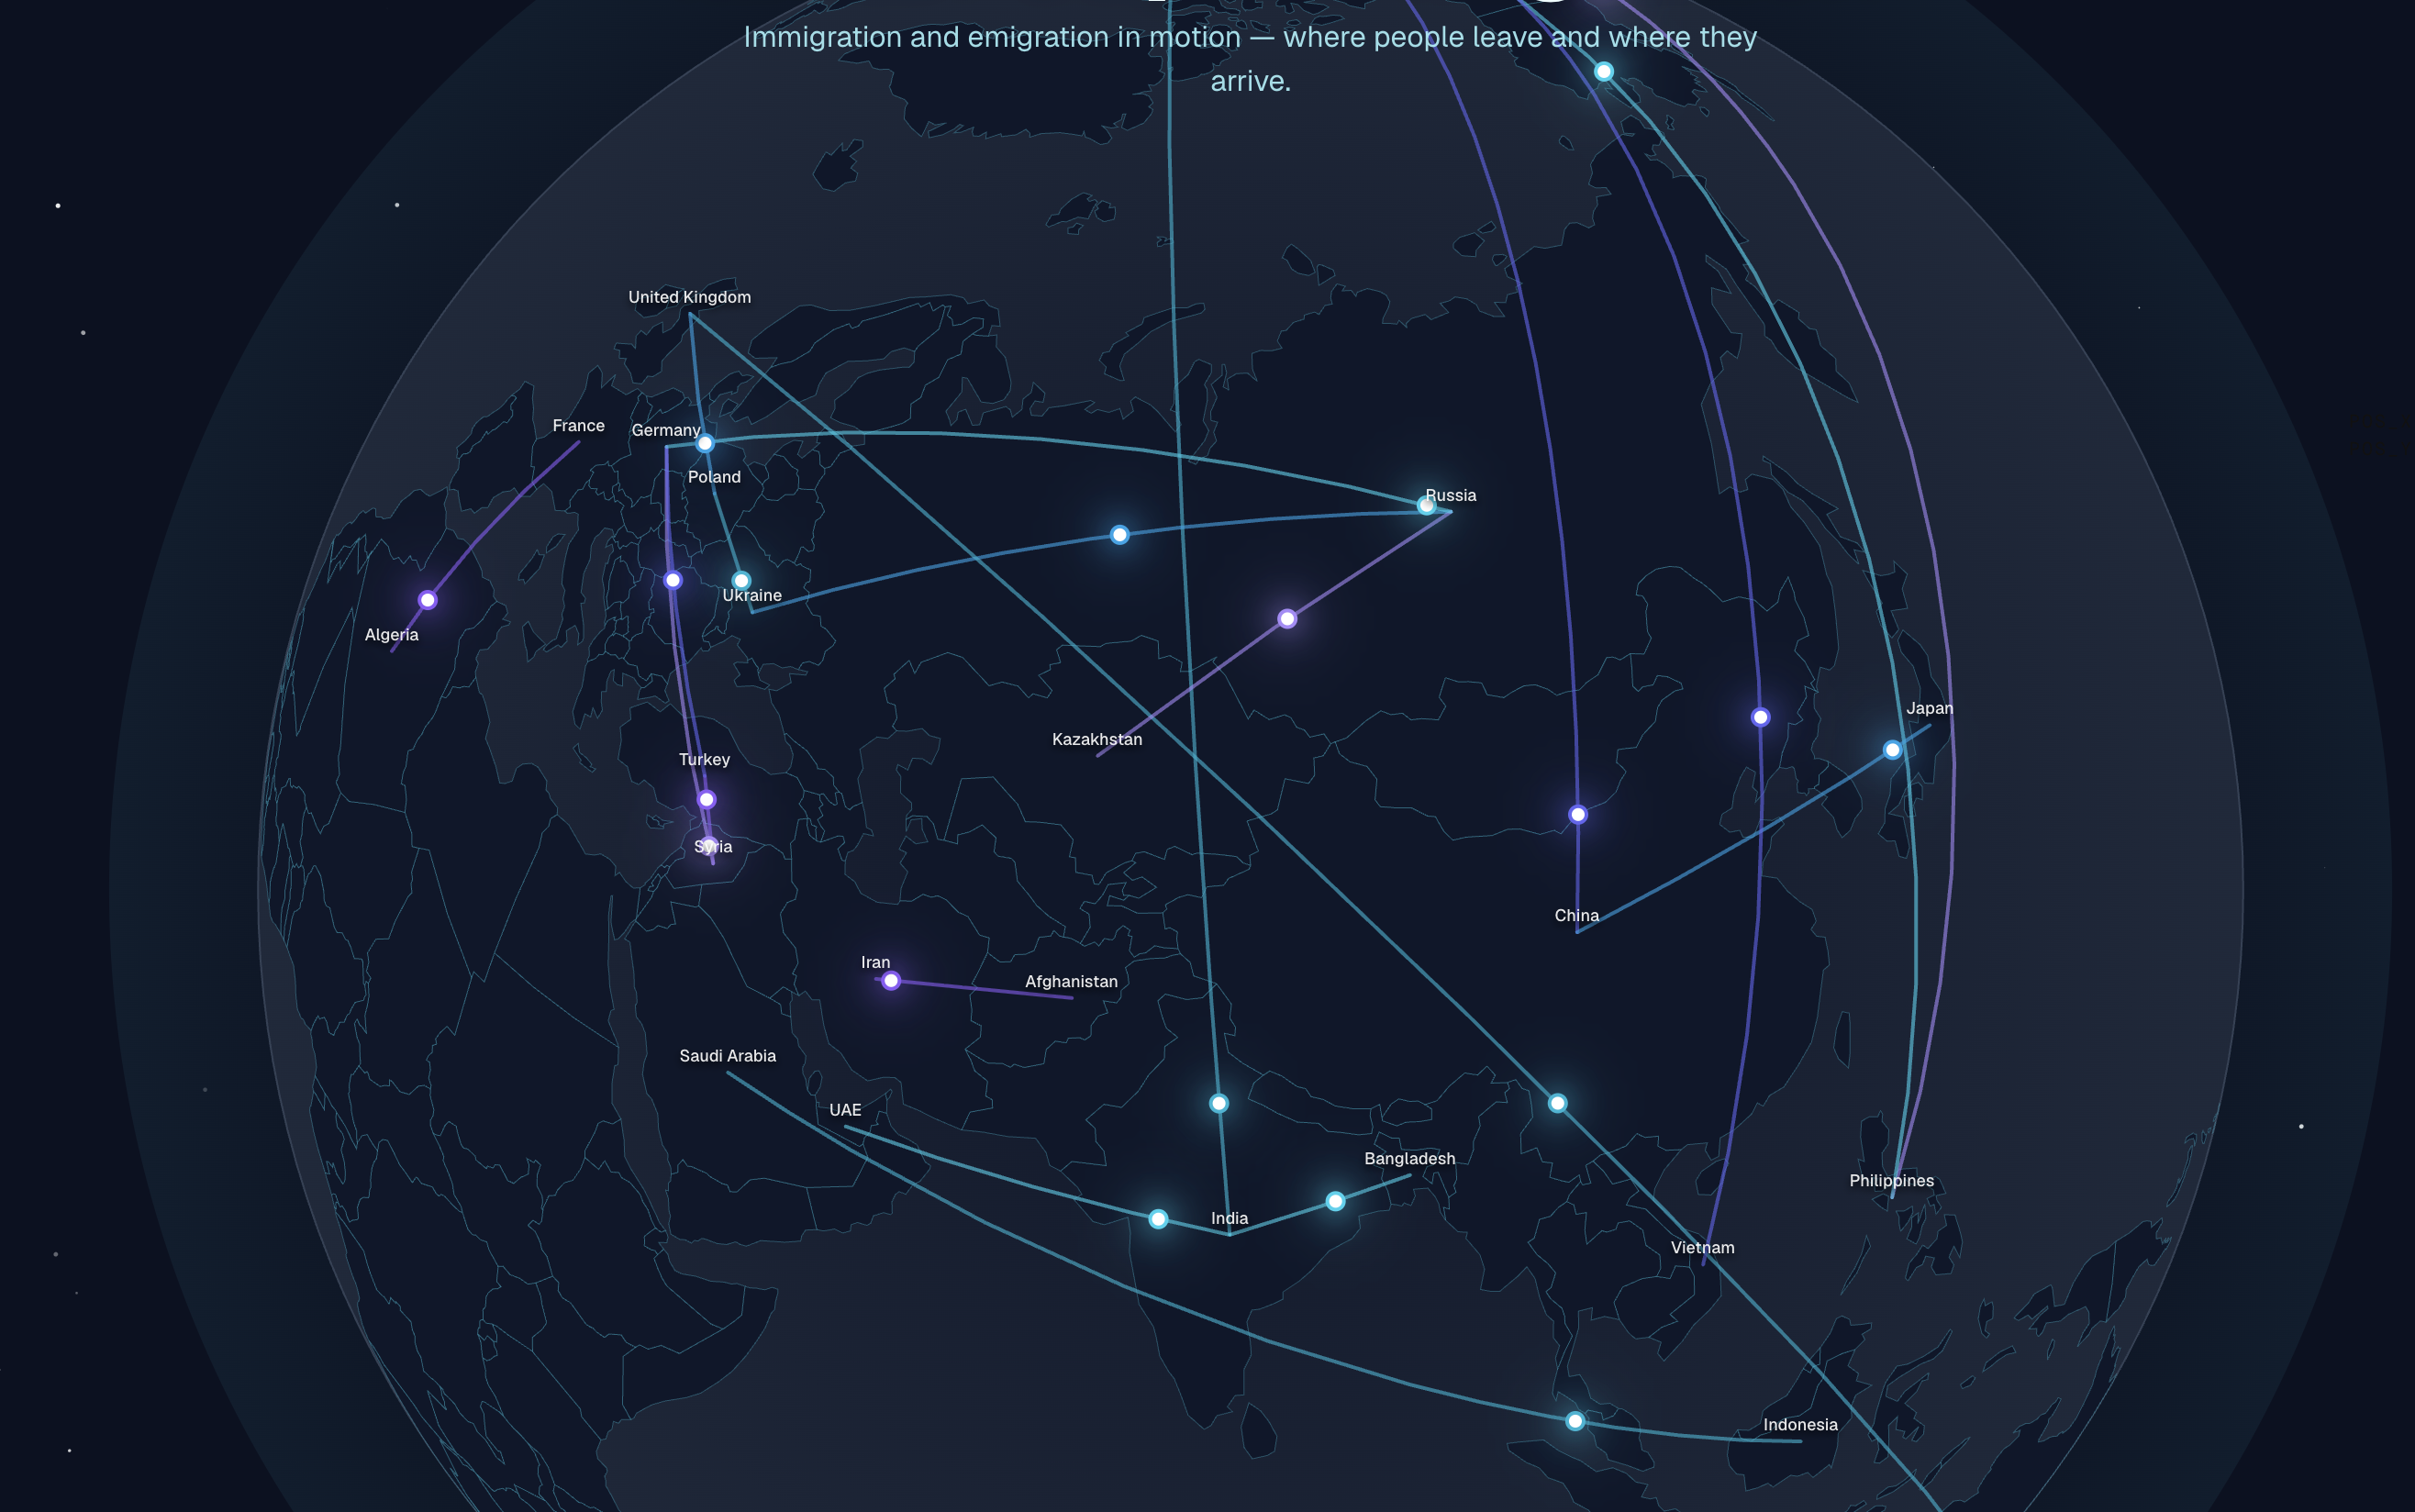
United Nations — Human Capital Migration
An artistic D3.js visualization of global immigration and emigration flows.
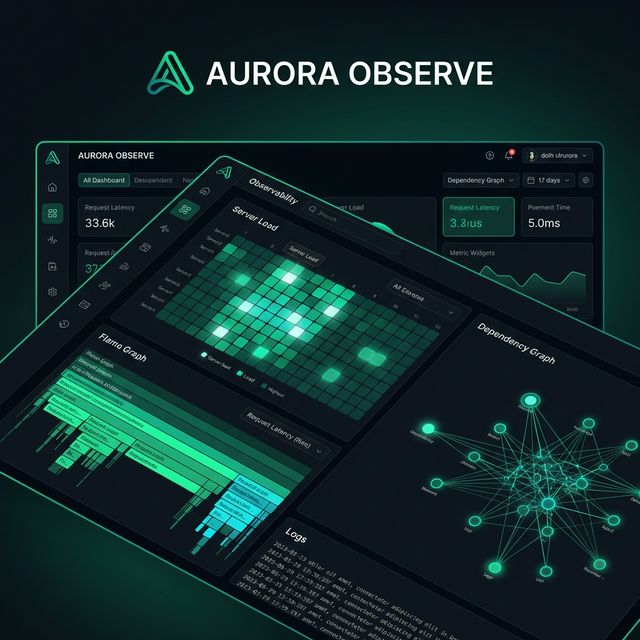
Datadog-Inspired — Observability Workbench
A developer-facing visualization workbench for complex observability telemetry and system health.
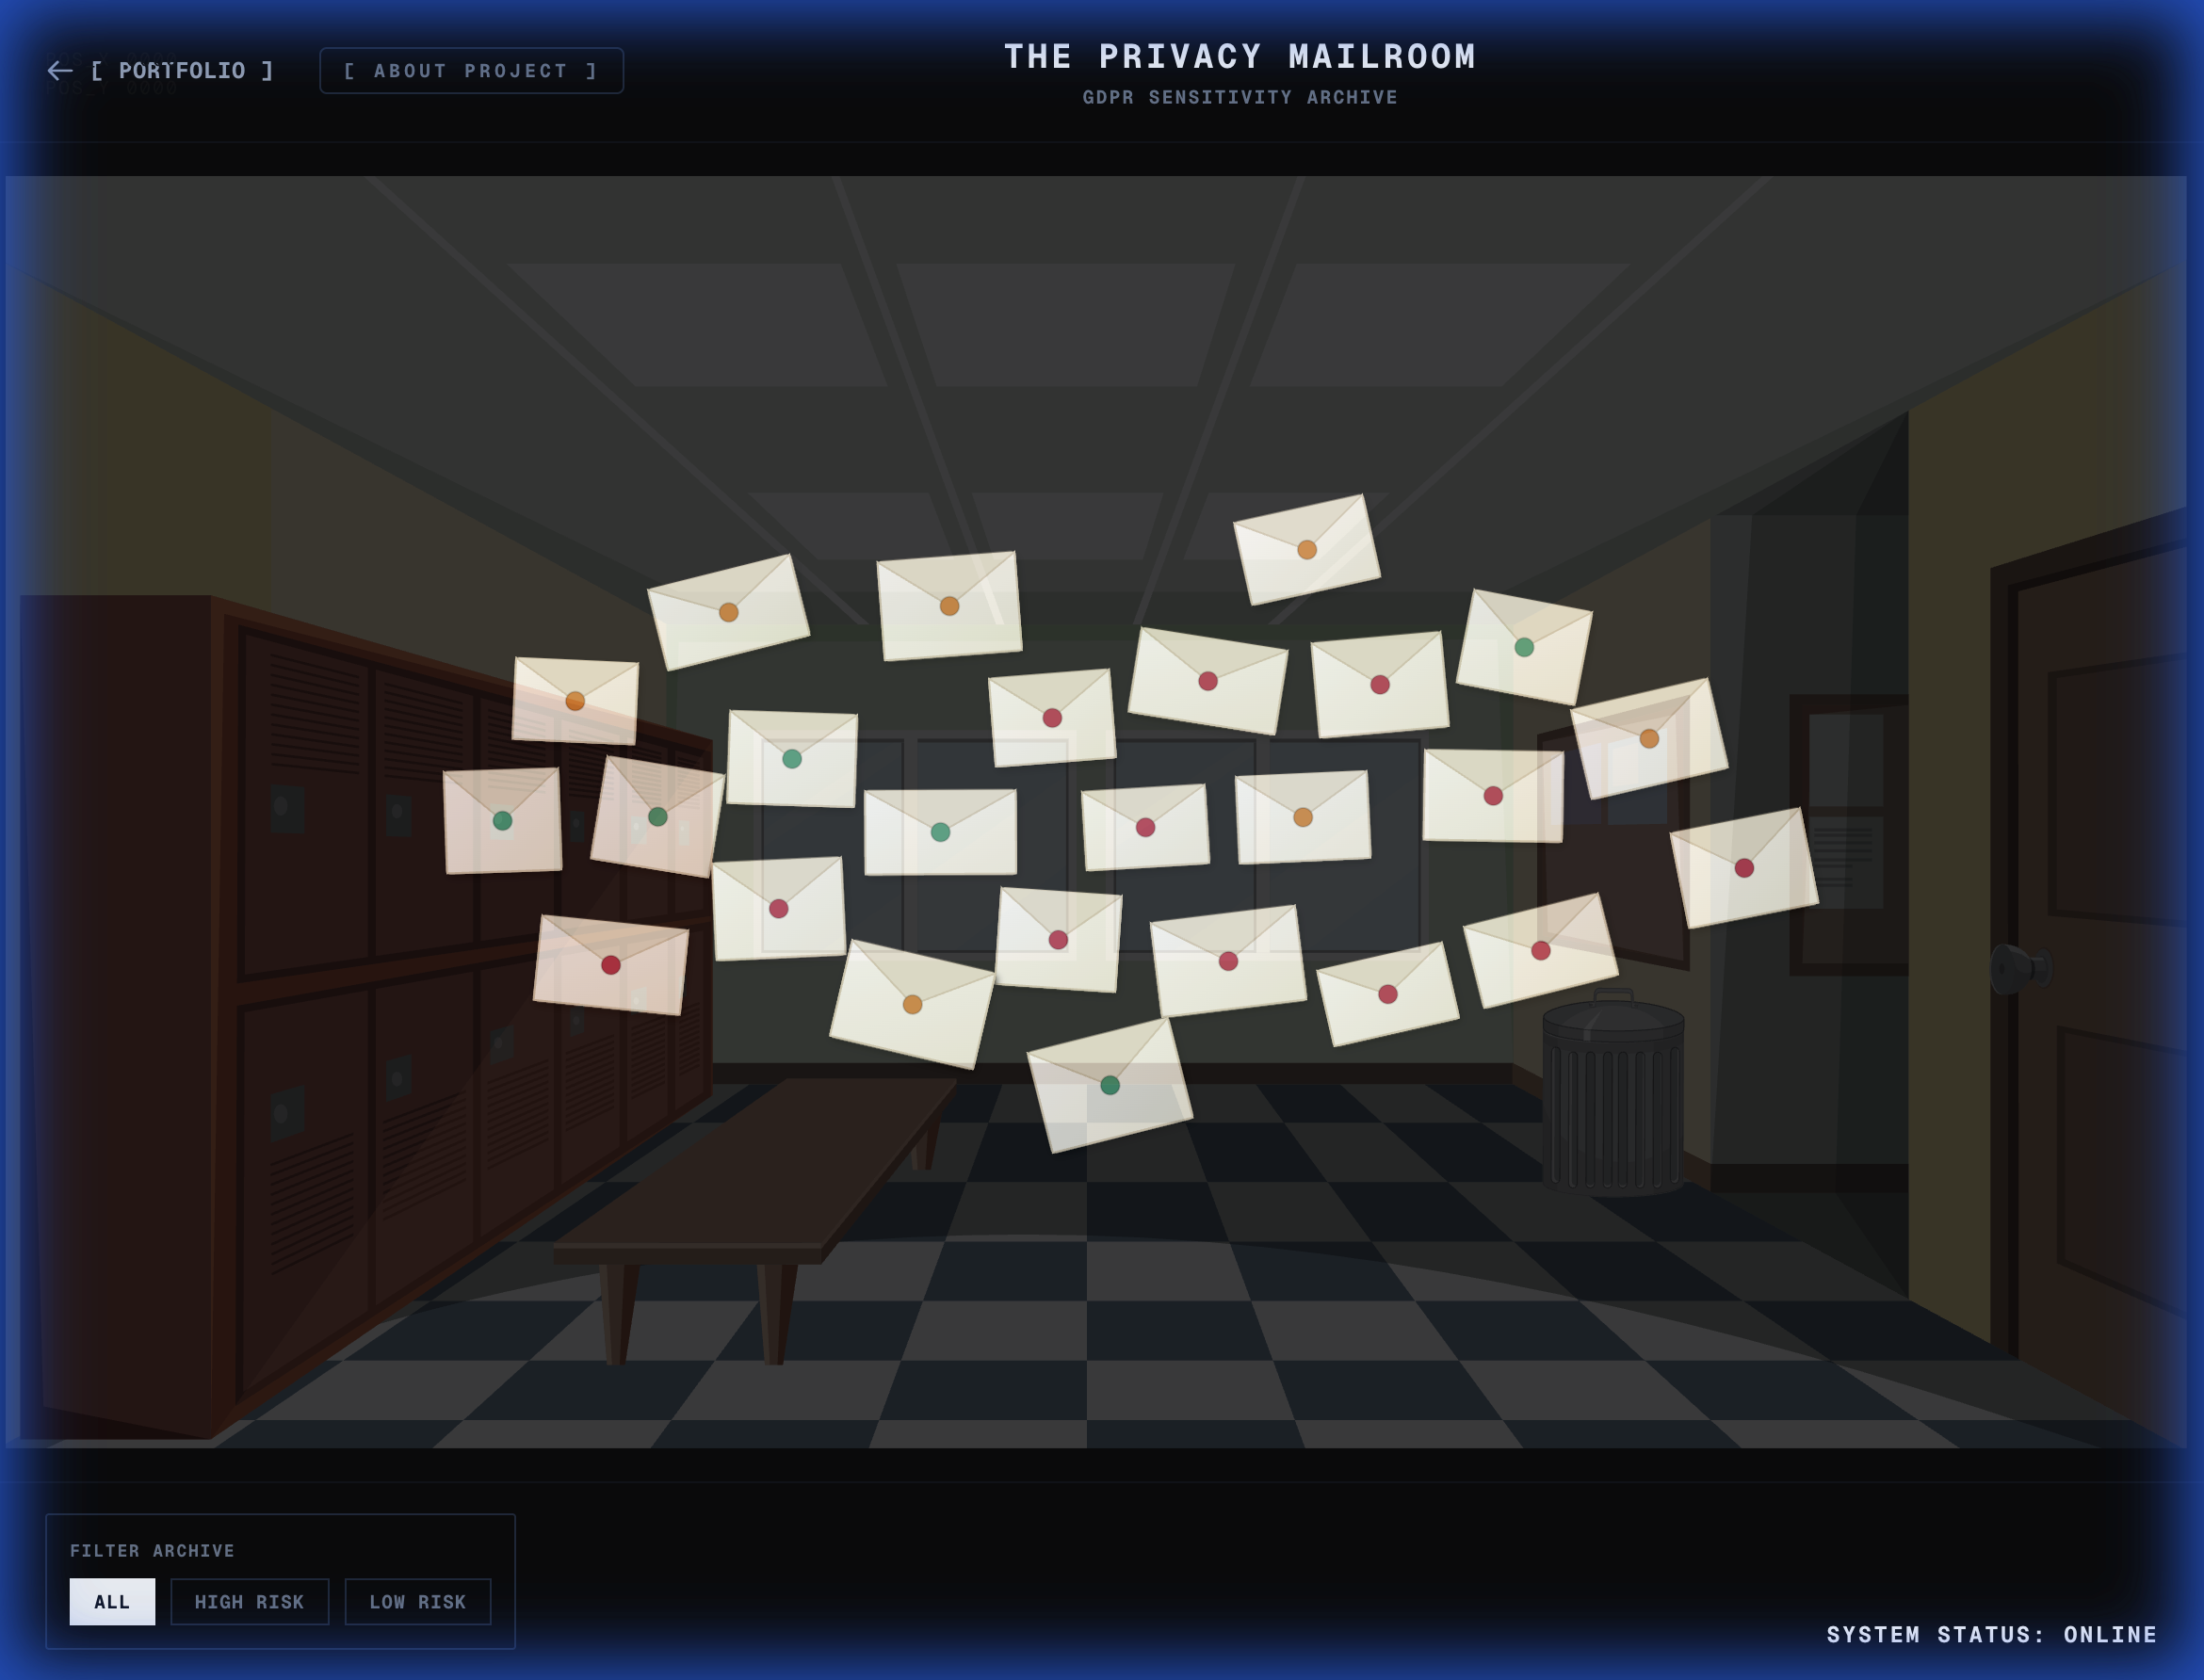
Pew Research — The Privacy Mailroom
An interactive archive of sealed letters representing personal data privacy and sensitivity.
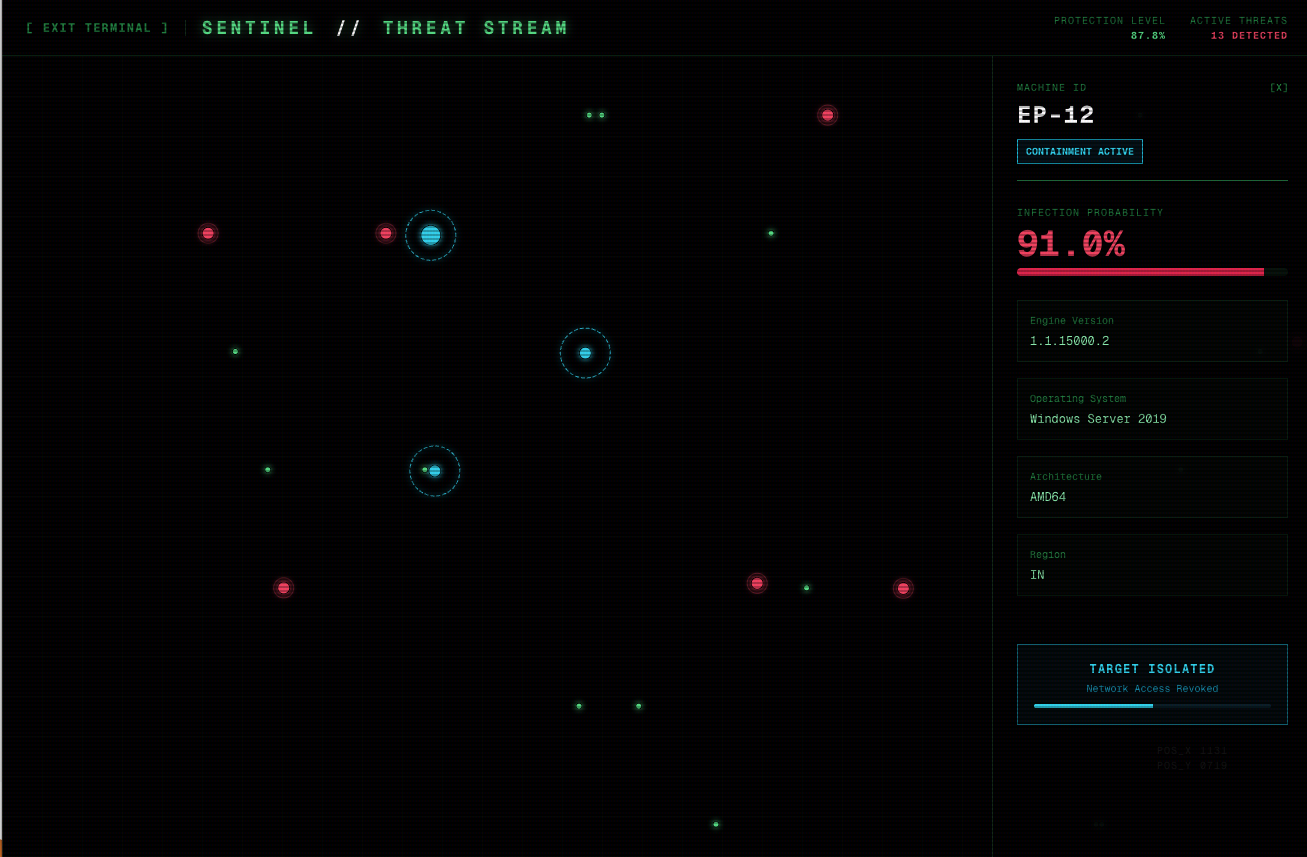
Microsoft — Malware Prediction Stream
Real-time visualization of endpoint security threats, malware propagation, and containment protocols.
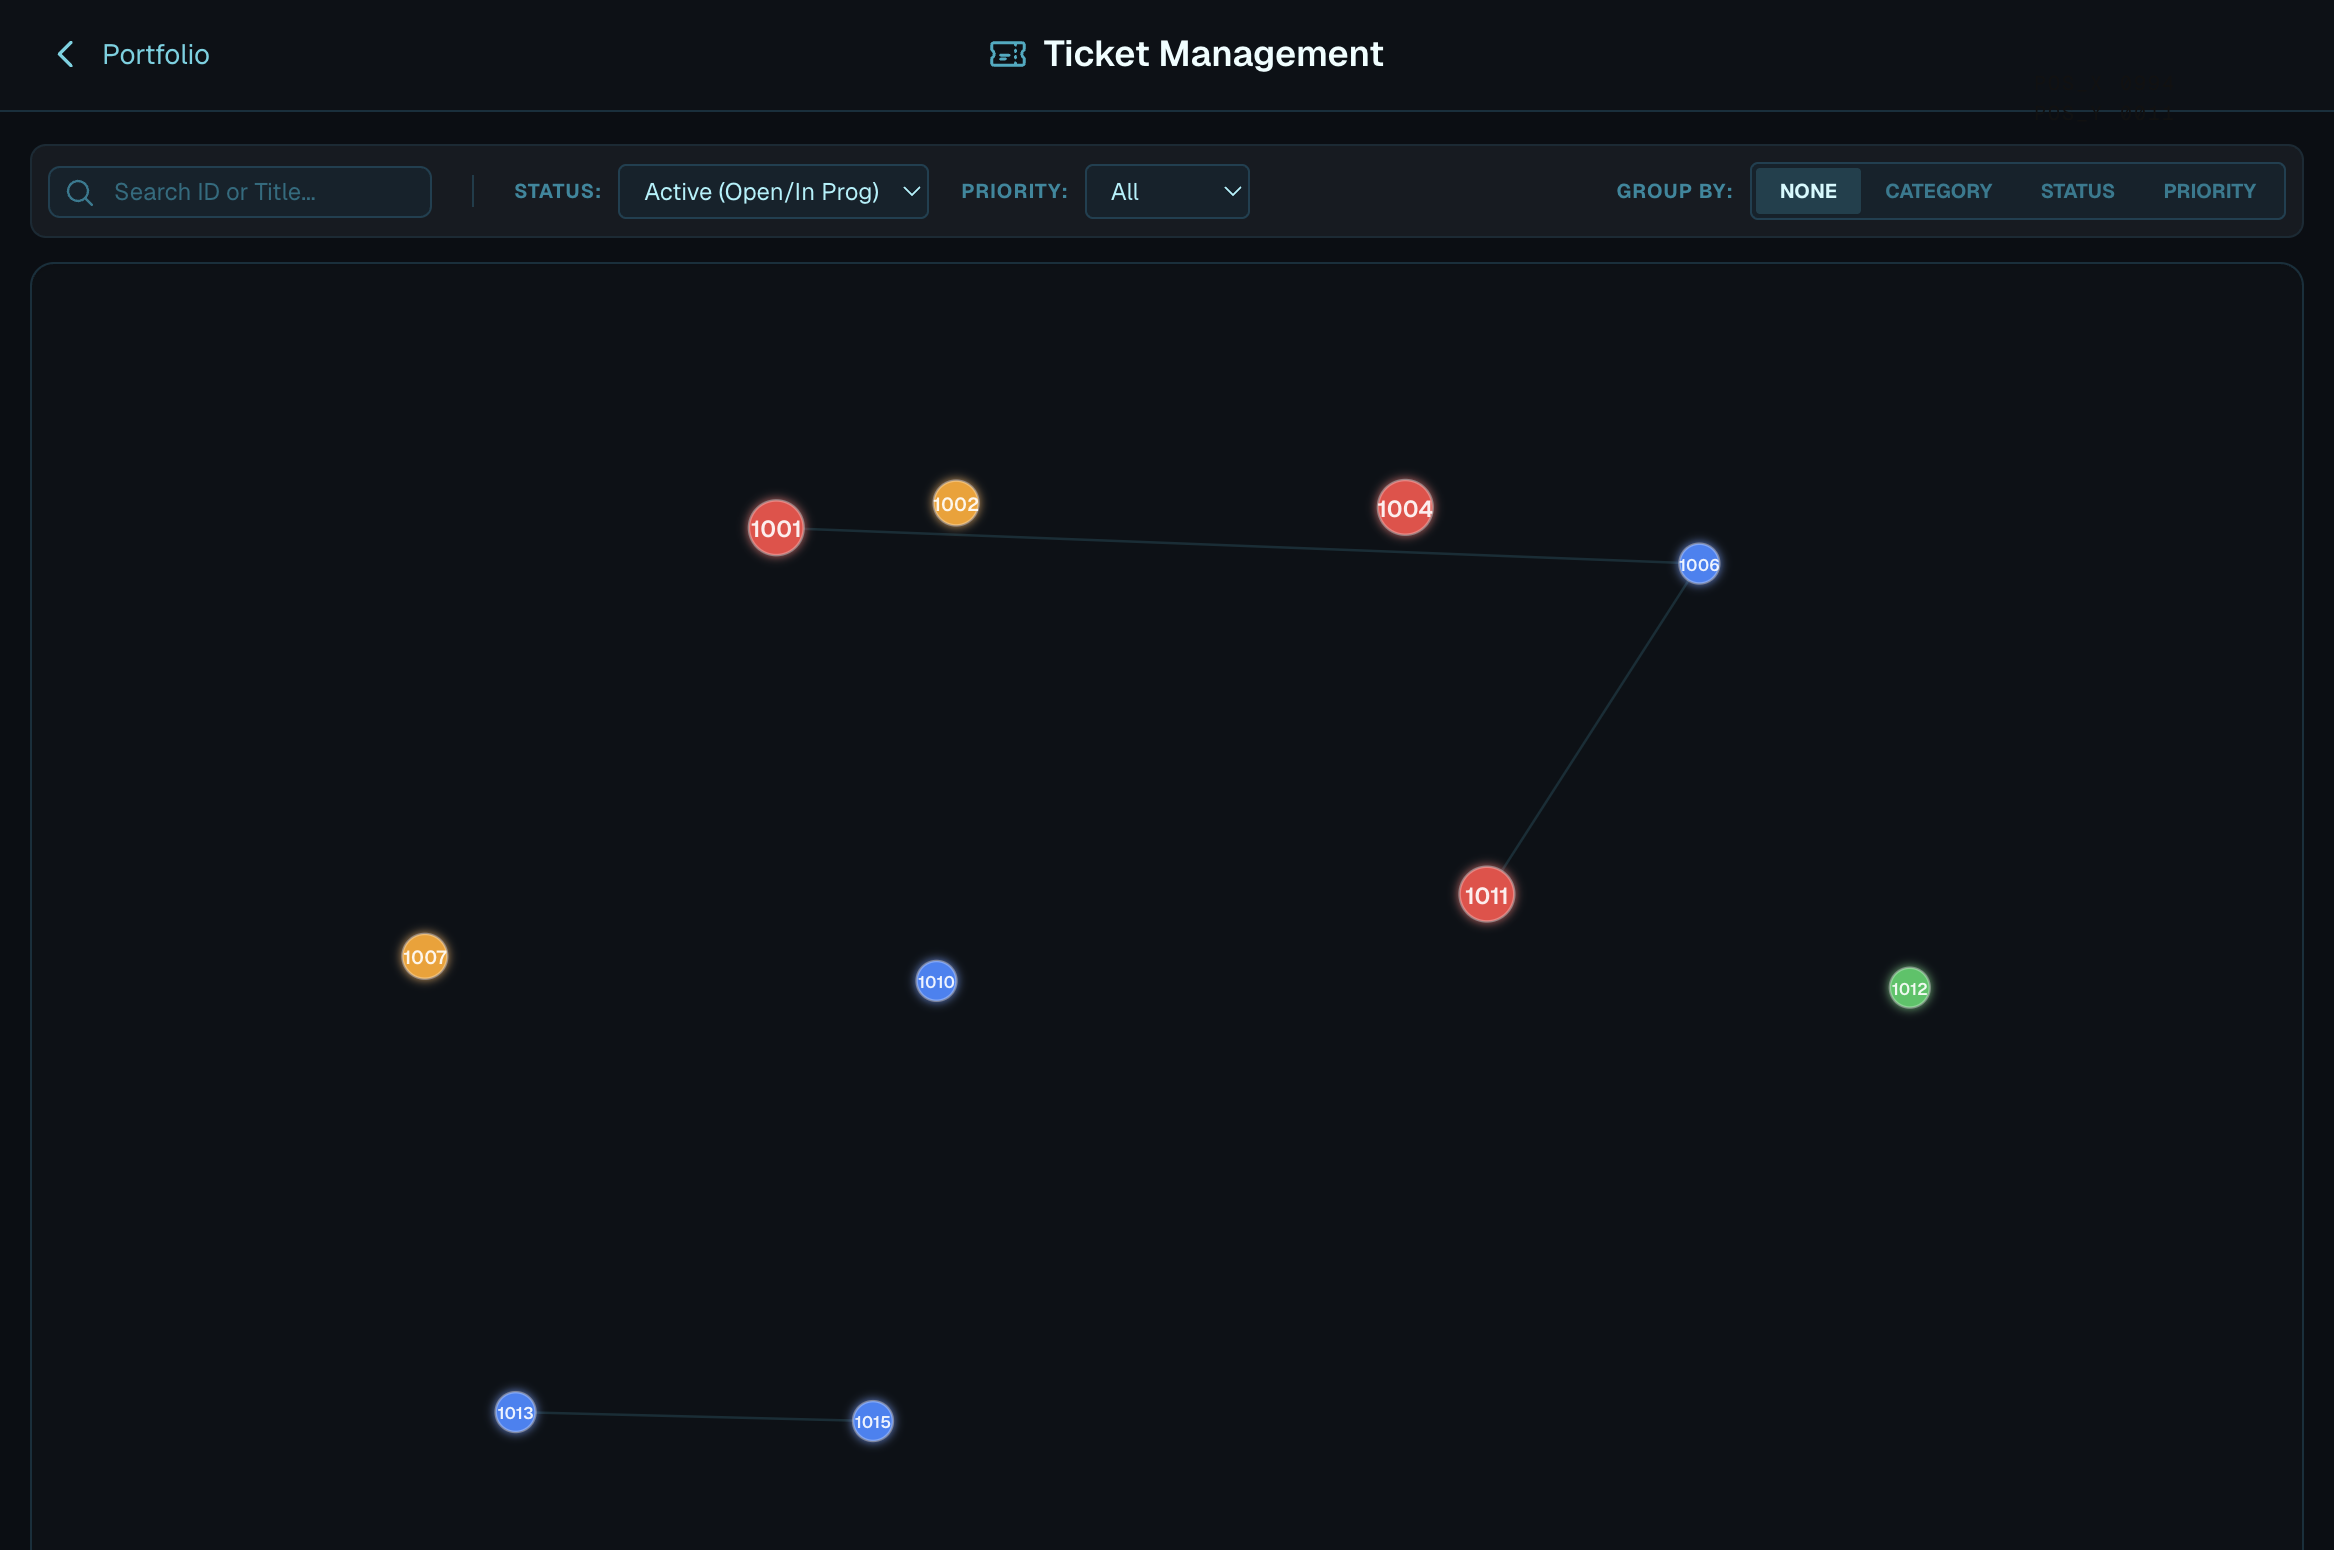
Cybersecurity Ticket Network
Data visualization of security tickets: status, priority, and resolution flows.

NIST — The Glass Fortress
A 3D crystalline visualization of system vulnerabilities, showcasing severity as structural fractures.
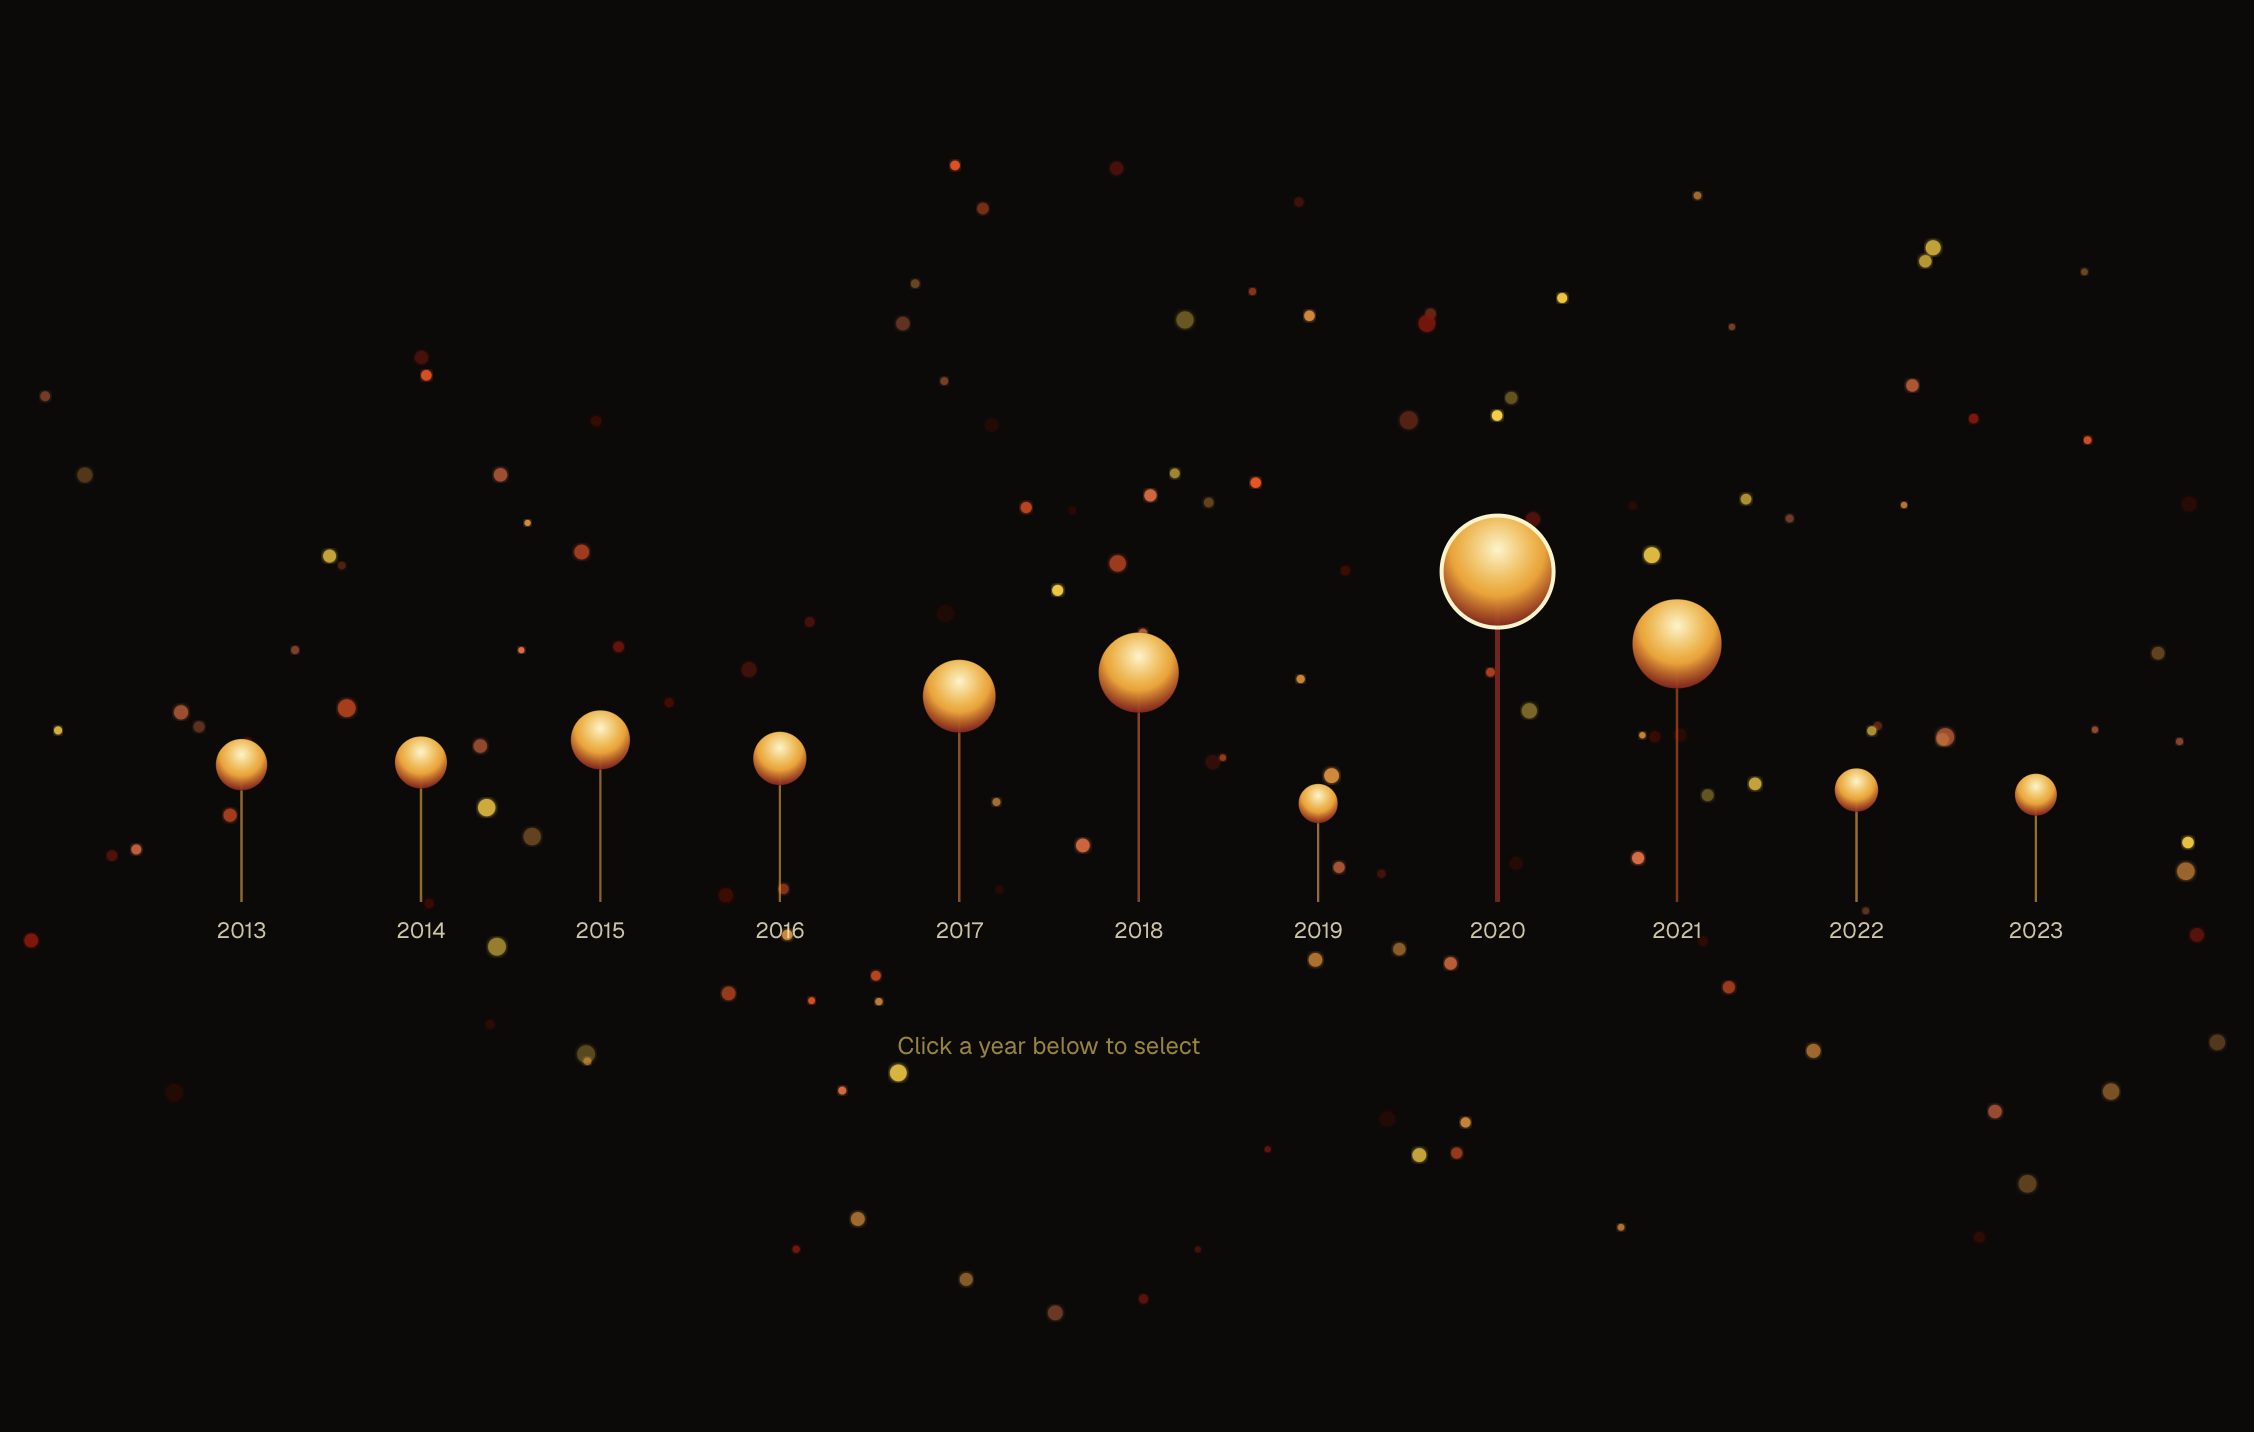
CAL FIRE — California Wildfire Data
An artistic D3.js visualization of acres burned by year, causes, and the scale of fire across California.